
The Non-Linear Kalman Signal Filter indicator for Metatrader 5 is an oscillator that creates buy & sell signals based on the Kalman trading formula.
The indicator pops up in a separate chart window as a brown and blue colored signal line.
How to find bullish and bearish trends with this technical indicator?
- A bullish trend occurs when the blue colored Kalman signal line gets displayed on the chart.
- A bearish trend occurs when the brown colored Kalman signal line gets displayed on the chart.
The following indicator inputs and parameters can be modified: filter period, filter order, price, zero mean period, smoothing period, smoothing MA mode, and color changing mode.
The Non-Linear Kalman Signal Filter indicator works for any trading instrument (Forex, Stocks, Metals, Indices, etc.) that can be loaded in the Metatrader 5 platform.
First, familiarize yourself with this technical indicator and test it on a demo account.
It supports all time frames and Forex pairs.
Download Indicator 🆓
Nonlinear Kalman filter (zm).mq5 Indicator (MT5)
Chart Example
The following chart shows how the Non-Linear Kalman Signal Filter Forex indicator looks like when applied to the MT5 chart.
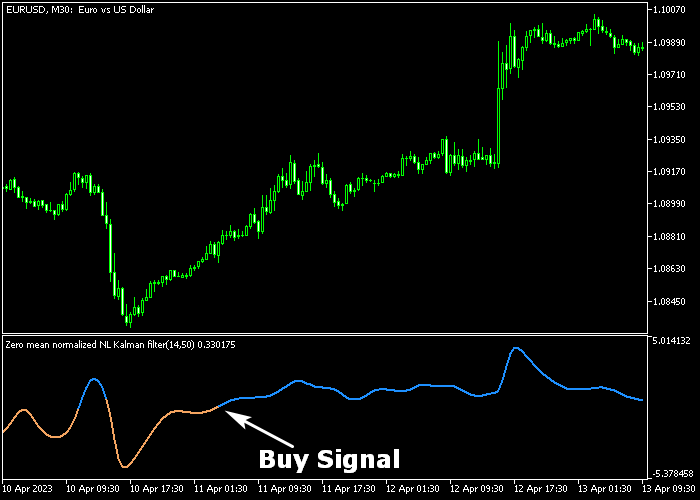
How To Buy And Sell Forex Pairs With The Non-Linear Kalman Signal Filter Indicator?
Find a simple trading example below:
Buy Signal
- The start of the blue colored signal line is a buy signal.
- Open a buy trade and place your stop loss 3 pips below most recent swing support.
- Close the buy trade for a fixed profit target of your preference, or wait for a sell signal.
Sell Signal
- The start of the brown colored signal line is a sell signal.
- Open a sell trade and place your stop loss 3 pips above most recent swing resistance.
- Close the sell trade for a fixed profit target of your preference, or wait for a buy signal.
Download Now 🆓
Nonlinear Kalman filter (zm).mq5 Indicator (MT5)
Frequently Asked Questions
How Do I Install This Custom Indicator On Metatrader 5?
- Open the MT5 trading platform
- Click on the File menu button located at the top left part of the platform
- Click on Open Data Folder > MQL5 folder > Indicators
- Copy the Nonlinear Kalman filter (zm).mq5 indicator file in the Indicators folder
- Close and restart the trading platform
- You will find the indicator here (Navigator window > Indicators)
- Drag the indicator to the chart to get started with it!
How Do I Edit This Indicator?
- Click in the open chart with your right mouse button
- In the dropdown menu, click on Indicator List
- Select the indicator and click on properties
- Now you can edit the inputs, colors, levels, scale and visualization
- Finally click the OK button to save the new configuration