
About the 1-2-3 Pattern indicator
The 1-2-3 Pattern indicator for MT4 is designed to identify short-term trend reversals on intraday charts.
It plots the classic 1-2-3 price pattern, marking potential bullish and bearish turning points for scalping and intraday trading.
The indicator is particularly useful on 1-minute, 5-minute, and 15-minute charts, helping traders anticipate market moves before they fully develop.
It works by highlighting three consecutive price points that form a recognizable pattern in trending or consolidating markets.
When the third point aligns with market direction, it signals a potential buy or sell opportunity.
This makes it a practical tool for traders looking to act quickly on emerging trends while staying in line with the broader market direction.
Free Download
Download the “1-2-3-pattern-indicator.ex4” MT4 indicator
Key Features
- Detects 1-2-3 price patterns for bullish and bearish market moves.
- Works on multiple intraday time frames: M1, M5, M15.
- Highlights the 3rd line as the actionable trading signal.
- Can be used standalone or with trend indicators.
- Helps identify short-term reversals for scalping and intraday trades.
- Easy to read and interpret, even for beginners.
Indicator Chart
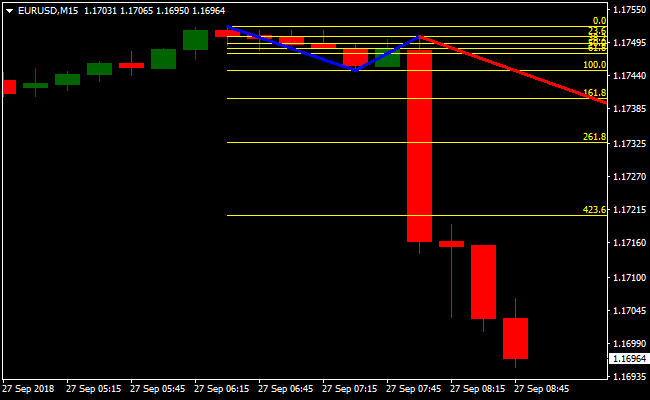
The image below shows the 1-2-3 Pattern indicator applied to an MT4 chart.
It marks potential bullish and bearish reversals using the third line of the pattern.
Blue lines indicate a buy setup, and red lines indicate a sell setup.
Guide to Trade with 1-2-3 Pattern indicator for MT4
Buy Rules
- Open a buy trade when the 3rd line of the 1-2-3 Pattern indicator turns blue.
- Confirm the overall trend is upward using a trend-following indicator.
- Ensure price is above a reliable moving average or trend line.
Sell Rules
- Open a sell trade when the 3rd line of the 1-2-3 Pattern indicator turns red.
- Confirm the overall trend is downward using a trend-following indicator.
- Ensure price is below a reliable moving average or trend line.
Stop Loss
- For buy trades, place a stop loss just below the 2nd point of the pattern.
- For sell trades, place a stop loss just above the 2nd point of the pattern.
- Allow some room for normal market fluctuations and volatility.
- Trail the stop as price moves in your favor to lock in profits.
Take Profit
- Close trades when an opposite 1-2-3 signal appears.
- Alternatively, target the nearest swing high for buys or swing low for sells.
- Adjust dynamically if the trend is strong or if price accelerates.
1-2-3 Trading Pattern + Detrended Synthetic Price GO Oscillator Forex Trend Strategy
This MT4 strategy combines the precision of the 1-2-3 Pattern indicator with the momentum confirmation of the Detrended Synthetic Price GO Oscillator.
The 1-2-3 Pattern identifies bullish and bearish reversal points by highlighting the 3rd line in blue or red, while the Oscillator uses green lines for bullish momentum and red lines for bearish momentum.
By combining pattern recognition with momentum signals, this strategy helps traders focus on high-probability entries and follow the prevailing market trend.
It works particularly well on M5 and M15 charts and is ideal for London and New York sessions when price movement is stronger and more reliable.
Buy Entry Rules
- Wait for the 1-2-3 Pattern indicator’s 3rd line to turn blue, signaling a bullish pattern.
- Confirm that the Detrended Synthetic Price GO Oscillator shows green lines for bullish momentum.
- Enter a buy trade at the open of the next candle after confirmation.
- Set stop loss a few pips below the recent swing low or the bottom of the 1-2-3 pattern.
- Typical stop: 10–15 pips on M15, 5–8 pips on M5.
- Take profit: 15–30 pips on M15, 8–15 pips on M5, or exit if the oscillator turns red or the pattern reverses.
Sell Entry Rules
- Wait for the 1-2-3 Pattern indicator’s 3rd line to turn red, signaling a bearish pattern.
- Confirm that the Detrended Synthetic Price GO Oscillator shows red lines for bearish momentum.
- Enter a sell trade at the open of the next candle after confirmation.
- Set stop loss a few pips above the recent swing high or the top of the 1-2-3 pattern.
- Typical stop: 10–15 pips on M15, 5–8 pips on M5.
- Take profit: 15–30 pips on M15, 8–15 pips on M5, or exit if the oscillator turns green or the pattern reverses.
Advantages
- Combining pattern recognition with momentum confirmation reduces false entries.
- Provides clear and structured rules for both bullish and bearish trades.
- Works well on M5 and M15, making it suitable for scalping and short-term trend trades.
- Targets and stop losses are manageable, balancing risk and reward effectively.
- Helps traders capture both reversals and momentum continuation moves.
Drawbacks
- Waiting for both pattern and momentum confirmation may miss the initial part of a trend.
- Major news events can invalidate patterns and oscillator signals.
Example Case Study 1 (M5 Buy)
On EURUSD M5 during the London session, the 1-2-3 Pattern 3rd line turned blue, and the Detrended Synthetic Price GO Oscillator confirmed green lines.
A buy trade was entered at 1.10250. The recent swing low was 1.10200, so the stop loss was set at 1.10200, giving a risk of 5 pips.
Price moved to 1.10420 over the next 10 minutes. The trade was closed at that level, resulting in a profit of 17 pips.
Example Case Study 2 (M15 Sell)
On GBPUSD M15, the 1-2-3 Pattern 3rd line turned red, and the oscillator showed red lines confirming bearish momentum.
A sell trade was entered at 1.31850. The recent swing high was 1.31940, so the stop loss was set at 1.31890, giving a risk of 9 pips.
Price fell to 1.31630 over 30 minutes.
The trade was closed at that level, resulting in a profit of 22 pips.
Strategy Tips
- Focus on major currency pairs with low spreads to reduce trading costs and slippage.
- Avoid taking trades during low liquidity periods, such as late Asian sessions.
- Keep position sizes consistent and risk only a small percentage of your account per trade.
- Do not chase trades; wait for the next confirmed setup if a trade is missed or the pattern fails.
- Use trailing stops in strong trending moves to lock in additional profits beyond your initial target.
- Pay attention to major economic news events and avoid trading right before releases to prevent unpredictable price spikes.
Download Now
Download the “1-2-3-pattern-indicator.ex4” Metatrader 4 indicator
FAQ
What time frames are best for the 1-2-3 Pattern indicator for MT4?
The indicator works best on 1-minute, 5-minute, and 15-minute charts but can be applied to any intraday timeframe.
Can it be used alone?
Yes, it can be used as a standalone tool, though combining it with a trend-following indicator improves reliability.
How are the patterns numbered?
Each pattern marks points 1, 2, and 3. The 3rd point is the key entry signal for trades.
Can the settings be adjusted?
Yes, the period settings for pattern detection can be modified in the indicator’s inputs tab to match your preferred trading style.
Summary
The 1-2-3 Pattern indicator for MT4 is an effective tool for spotting short-term reversals.
It simplifies intraday trading by marking critical price points and providing actionable buy and sell signals.
The indicator is intuitive and can be combined with other technical tools for higher accuracy.
Forex traders will appreciate its ability to highlight emerging opportunities quickly and help make informed decisions in fast-moving markets.
Its adjustable settings and visual signals make it suitable for scalpers and day traders looking for precise entry points.


