
About the 123 Patterns V7 Indicator
The 123 Patterns V7 indicator for MT4 is a breakout-based trading tool designed to capture directional price moves after consolidation phases.
It focuses on simple price behavior and highlights potential breakout zones directly on the chart, making it easy to spot actionable opportunities.
The indicator plots two colored breakout lines.
A blue line marks bullish breakout levels, while a red line marks bearish breakout levels.
When price closes beyond one of these levels, it signals a possible continuation move in that direction.
In addition to breakout levels, the indicator shows the most recent signal, BUY or SELL, in the upper left corner of the chart.
It also displays current spread and ratio information, which helps with execution awareness.
The 123 Patterns V7 works best when aligned with broader market direction, making it a solid companion to trend-following tools or oscillators.
Free Download
Download the “123-forex-patterns.ex4” MT4 indicator
Key Features
- Highlights bullish and bearish breakout levels.
- Uses color-coded lines for quick decision-making.
- Displays the latest breakout signal on the chart.
- Includes spread and ratio information.
- Works well with trend indicators and oscillators.
Indicator Chart
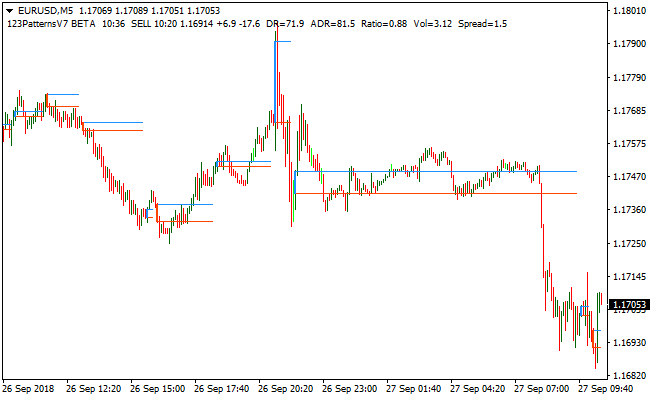
The image below shows the 123 Patterns V7 indicator applied to a price chart.
The blue and red breakout lines define key levels where price expansion may occur.
Breakout signals appear when price closes beyond these lines, pointing to potential trade entries.
Guide to Trade with the 123 Patterns V7 Indicator
Buy Rules
- Identify an overall upward market bias.
- Wait for price to approach the blue breakout line.
- Enter a buy trade after a candle closes above the blue line.
- Confirm momentum using a supporting indicator if needed.
Sell Rules
- Identify an overall downward market bias.
- Wait for price to approach the red breakout line.
- Enter a sell trade after a candle closes below the red line.
- Confirm momentum using a supporting indicator if needed.
Stop Loss
- Place the stop loss on the opposite side of the breakout line.
- Keep the stop tight during low-volatility conditions.
Take Profit
- Target the next visible support or resistance level.
- Scale out part of the position as price moves in your favor.
- Trail the stop once price confirms the breakout.
123 Patterns V7 Indicator + Flat Trend RSI Forex Breakout Scalping Strategy
This MT4 breakout strategy pairs the 123 Patterns V7 indicator with the Flat Trend RSI indicator.
The 123 Patterns V7 draws a blue breakout line for bullish breakouts and a red breakout line for bearish breakouts.
Flat Trend RSI confirms direction with a blue histogram for buys and a red histogram for sells.
Use this method on M1 and M5 where quick breakouts and momentum moves occur.
Buy Entry Rules
- Flat Trend RSI histogram must be blue, indicating a bullish trend.
- Price must close above the blue breakout line drawn by 123 Patterns V7.
- Enter a buy at the open of the next candle after the breakout close.
- Stop loss: a few pips below the breakout line or recent swing low. Typical SL: 5 to 10 pips on M1, 8 to 15 pips on M5.
- Take profit: 10 to 25 pips on M1, 15 to 30 pips on M5, or trail the stop if momentum continues.
Sell Entry Rules
- Flat Trend RSI histogram must be red, indicating a bearish trend.
- Price must close below the red breakout line drawn by 123 Patterns V7.
- Enter a sell at the open of the next candle after the breakout close.
- Stop loss: a few pips above the breakout line or recent swing high. Typical SL: 5 to 10 pips on M1, 8 to 15 pips on M5.
- Take profit: 10 to 25 pips on M1, 15 to 30 pips on M5, or trail the stop if momentum holds.
Advantages
- Confirmation from Flat Trend RSI reduces false breakouts and improves signal quality.
- The 123 Patterns V7 breakout lines mark clear trigger points for entries.
- Rules are simple and repeatable, which helps during fast market conditions.
- Suitable for lower timeframes with tight stop loss and clear targets.
- Works best on major pairs that offer low spread and steady liquidity.
Drawbacks
- Breakouts can fail and stop you out before momentum resumes.
- The method needs quick execution and discipline to follow strict sizing and exits.
Case Study 1 (M1 Buy Breakout)
On EURUSD M1 during the London session, the Flat Trend RSI turned blue.
Price closed above the 123 Patterns V7 blue breakout line at 1.11025.
Enter buy at 1.11030. Stop loss was set at 1.11015, about 8 pips risk.
Price climbed to 1.11055 within two minutes and the trade closed for +12 pips.
Case Study 2 (M5 Sell Breakout)
On GBPUSD M5 during the New York session, the Flat Trend RSI histogram turned red.
Price closed below the 123 Patterns V7 red breakout line at 1.32580.
Enter sell at 1.32575. Stop loss was set at 1.32595, about 10 pips risk.
Price dropped to 1.32390 over the next 27 minutes and the trade closed for +18 pips.
The bearish trend held until the target was reached.
Strategy Tips
- Focus on clean chart conditions where price is not stuck between support and resistance levels. Breakouts work best when the market has room to move.
- Avoid entering trades if the breakout candle is unusually large because it often reduces the reward to risk ratio.
- Use a small trailing stop once price moves at least halfway to your profit target. This protects gains without cutting the move too early.
- If the Flat Trend RSI color flips back shortly after entry, consider closing early because momentum has weakened.
- Track the average breakout range of your pair. Some pairs offer consistent 10 to 15 pip bursts, while others move slower.
- Keep your chart free of unnecessary tools. Faster visual decisions improve reaction time on lower timeframes.
- Check spreads during off-hours and avoid trading when spreads widen because it reduces your net profit on scalps.
- If multiple breakouts occur in a tight zone, skip them. Consolidation after repeated failed attempts usually produces choppy results.
- Always log your trades. After 20 to 30 trades you will see which pairs and times of day give you the best breakout performance.
Download Now
Download the “123-forex-patterns.ex4” Metatrader 4 indicator
FAQ
How does the indicator identify breakout levels?
The indicator analyzes recent price behavior and plots breakout lines at key levels where price expansion is likely to occur.
Is trend confirmation required before taking signals?
Trend confirmation is not mandatory, but aligning trades with the broader direction reduces the chance of false breakouts.
Can the indicator be customized?
Yes, users can adjust settings from the inputs tab to better match their trading style and preferred timeframes.
Does it work on intraday and higher timeframes?
It can be applied to both intraday and higher timeframes, though breakout behavior may vary depending on market conditions.
Summary
The 123 Patterns V7 MT4 indicator focuses on one of the most widely used trading concepts, breakouts.
Marking bullish and bearish breakout zones directly on the chart helps forex traders react quickly when price starts moving with strength.
Its simple visual design, combined with real-time signal display and additional market data, makes it practical for active trading.
This indicator can become a useful part of a breakout-based trading strategy.


