
About the 5 Day Breakout Indicator
The 5 Day Breakout indicator for MT4 marks the high and low price levels over the past five days using two red lines.
It identifies potential breakout opportunities in trending or consolidating markets.
A breakout buy occurs when the price closes above the 5-day high.
A breakout sell occurs when the price closes below the 5-day low.
The default period is 5 days but can be adjusted to suit your preferred strategy.
Use it with a trend-following tool or other technical indicators to filter false breakouts.
Free Download
Download the “5-day-breakout.mq4” MT4 indicator
Key Features
- Displays 5-day high and low price levels as red lines.
- Identifies breakout trading opportunities in trending or range-bound markets.
- Adjustable breakout period to match your trading style.
- Can be used standalone or with other technical indicators for confirmation.
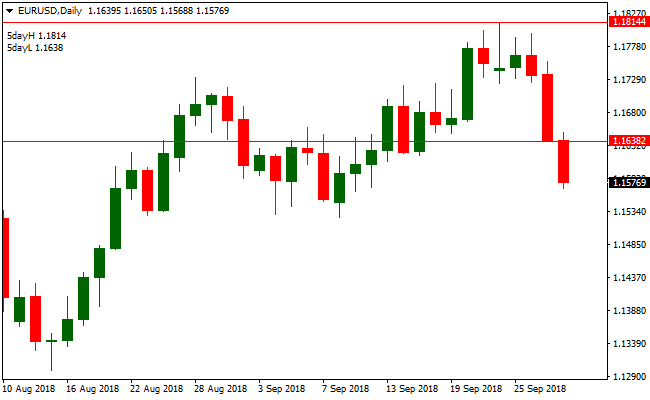
Indicator Chart
The chart shows red lines marking the 5-day high and low prices.
Breakouts above or below these lines generate trade signals.
Traders can easily identify breakout opportunities and key support/resistance levels.
Guide to Trade with 5 Day Breakout Indicator
Buy Rules
- Open a buy trade when the price closes above the 5-day high line.
- Confirm the trend is upward or use a trend-following indicator for confirmation.
- Enter on a candle close above the breakout line.
- Avoid buying in strong sideways markets to reduce false signals.
Sell Rules
- Open a sell trade when the price closes below the 5-day low line.
- Confirm the trend is downward or use a trend-following indicator for confirmation.
- Enter on a candle close below the breakout line.
- Avoid selling in sideways markets to reduce false signals.
Stop Loss
- For buy trades, place the stop below the breakout candle’s low.
- For sell trades, place the stop above the breakout candle’s high.
- Alternatively, use the opposite breakout line as a reference for your stop.
Take Profit
- Close buy trades when price falls back below the 5-day high line.
- Close sell trades when price rises back above the 5-day low line.
5‑Day High/Low Breakout + Trend Predictor MT4 Breakout Strategy
This breakout strategy uses the 5‑Day Breakout MT4 Forex Indicator and the Trend Predictor V1.0 MT4 Forex Indicator to identify high-probability breakout trades.
The 5‑Day Breakout indicator signals a bullish breakout when price closes above the 5-day high red line and a bearish breakout when price closes below the 5-day low red line.
To reduce false breakouts, the Trend Predictor confirms trend direction with blue arrows for buy and red arrows for sell.
By combining breakout signals with trend confirmation, traders can enter trades with more confidence.
This strategy works well on M5 and H1 charts, making it suitable for scalpers and intraday traders who want to catch breakout moves early.
Buy Entry Rules
- Wait until price closes above the 5‑day high red line on your chosen timeframe.
- Confirm there is a blue buy arrow from the Trend Predictor indicator.
- Enter a long trade at the next candle open after breakout and confirmation.
- Set stop loss below the breakout candle low or a few pips below the 5‑day high.
- Set take profit at the next resistance level or use a trailing stop if price continues to move favorably.
Sell Entry Rules
- Wait until price closes below the 5‑day low red line on your chart timeframe.
- Confirm there is a red sell arrow from the Trend Predictor indicator.
- Enter a short trade at the next candle open after breakdown and confirmation.
- Set stop loss above the breakout candle high or a few pips above the 5‑day low.
- Set take profit at the next support level or use a trailing stop if price continues downward.
Advantages
- Combines clear breakout signals with trend confirmation for higher reliability.
- Works well on M5 and H1 charts for intraday breakout opportunities.
- Captures strong trending moves after consolidation periods.
- Simple rules make it easy to follow and implement on multiple pairs.
- Dynamic take profit options allow adaptation to market volatility.
Drawbacks
- Breakouts can fail, and price may revert, causing false signals.
- Patience is required as breakout signals may not occur every day.
- Low volatility periods may produce few or weak signals.
Case Study 1: EUR/USD on M5
On the 5-minute EUR/USD chart, the 5-Day Breakout high line was at 1.1025.
Price closed above it at 1.1030, and a blue arrow appeared on the Trend Predictor confirming a bullish trend.
A buy trade was entered at 1.1032, stop loss set at 1.1020, and take profit at 1.1060 (a nearby resistance).
The price moved up steadily and hit the target, giving a gain of 28 pips within a few hours.
This shows how combining breakout and trend confirmation works on short timeframes.
Case Study 2: GBP/JPY on H1
On the 1-hour GBP/JPY chart, the 5-Day Breakout low line was at 161.50.
Price closed below at 161.40, and a red sell arrow appeared on the Trend Predictor.
A sell trade was opened at 161.35, stop loss at 161.85, and take profit at 160.50 (next support).
The price declined steadily, reaching the take profit for a gain of 85 pips.
Strategy Tips
- Look for breakouts that occur near the beginning of active trading sessions for higher momentum and better follow-through.
- Confirm breakout strength with volume or candlestick patterns, such as strong engulfing candles for extra reliability.
- Use higher timeframe trend direction (H4 or Daily) to filter trades and avoid entering against the major trend.
- Consider waiting for a retest of the breakout line before entering if price initially overshoots, to reduce false breakout risk.
- Set alerts on your indicators to catch breakout setups without needing to monitor the chart constantly.
- Combine the strategy with proper money management rules, such as limiting risk per trade to 1–2% of account balance.
- Be cautious during low liquidity periods, as breakouts may fail or reverse quickly.
- Keep a trading journal to track setups, outcomes, and pip gains/losses, so you can refine your entry and exit rules over time.
- Adjust stop loss and take profit dynamically based on recent volatility to avoid being stopped out prematurely.
Download Now
Download the “5-day-breakout.mq4” Metatrader 4 indicator
FAQ
Can the breakout period be adjusted?
Yes, you can change the default 5-day period to any number, for example 10 or 14, to fit your trading style.
Which markets is this indicator suitable for?
It works best on forex pairs but can also be applied to indices, commodities, or other charted instruments.
Can I combine it with other indicators?
Yes, using a trend-following indicator like an EMA or SMA can improve breakout accuracy and reduce false signals.
Which timeframes are ideal for breakouts?
This indicator works on multiple timeframes, from 15-minute charts for intraday trading to daily charts for swing setups.
Summary
The 5 Day Breakout MT4 indicator helps Forex traders spot key breakout levels with simple red lines marking the 5-day high and low prices.
It highlights potential buy and sell opportunities based on price breaking these levels.
Using it alongside trend indicators or other confirmation tools improves trade reliability and helps manage risk effectively.


