
About the 5 MA’s Signal Indicator
The 5 MA’s Signal Indicator for Metatrader 4 is a comprehensive trend-following system that utilizes multiple layers of price data to determine market direction.
By incorporating five distinct simple moving averages, this tool provides a clear hierarchy of trend strength, ranging from short-term momentum to long-term institutional cycles.
The periods are strategically set at 8, 21, 50, 100, and 200 to cover all phases of market movement.
This multi-layered approach helps traders distinguish between minor retracements and major trend reversals, which is a common challenge in volatile markets.
When all five averages align in a specific direction, it signals a high-probability trend that is backed by both short-term buyers and long-term investors.
Free Download
Download the “carter-ma-indicator.mq4” MT4 indicator
Key Features
- Integrates five simple moving averages into a single cohesive trading system.
- Uses distinct colors and styles to make each average easily identifiable on the chart.
- Features the 50 and 200 period averages to identify major bullish and bearish cycles.
- Provides faster 8 and 21 period averages to assist with precision entry and scalping.
- Acts as a dynamic support and resistance tool during strong trending phases.
- Offers fully customizable period settings to adapt to different trading styles or assets.
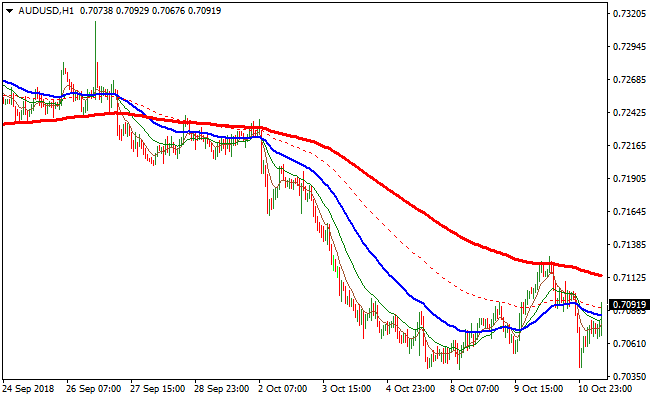
Indicator Chart
The 5 MA’s Signal Indicator displays five colorful lines across the price chart.
The sienna 8 MA and green 21 MA track the price closely for immediate momentum.
The blue 50 MA serves as the medium-term filter, while the red dotted 100 MA and solid red 200 MA define the long-term trend direction.
A crossover between the blue 50 MA and the red 200 MA signals a significant shift in the underlying market sentiment.
Guide to Trade with 5 MA’s Signal Indicator
Buy Rules
- Watch for the blue 50 period moving average to cross above the solid red 200 period moving average.
- Ensure the price is trading above the 8 and 21 period moving averages for confirmation of momentum.
- Wait for a small pullback where price touches either the 21 or 50 MA without closing below it.
- Enter a long position when the price resumes its upward movement away from the averages.
Sell Rules
- Look for the blue 50 period moving average to cross below the solid red 200 period moving average.
- Confirm that the currency pair is trading below the 8 and 21 period moving averages.
- Observe a temporary retracement higher that stays below the 50 period moving average.
- Open a short position as soon as the price starts to drop back below the faster moving averages.
Stop Loss
- Place the stop loss above the 50 period moving average for sell trades.
- Position the stop loss below the 50 period moving average for buy trades.
- Adjust the stop to the 200 period moving average for a more conservative, long-term approach.
Take Profit
- Exit the trade when the 8 period sienna moving average crosses back over the 21 period green moving average.
- Target the next major horizontal resistance level on the daily or weekly chart.
- Consider closing the position if the price closes decisively on the opposite side of the 50 period moving average.
5 MAs Signal + Waddah Attar MT4 Scalping Strategy
This MT4 scalping strategy combines the powerful trend detection of the 5 MAs Signal MT4 indicator with the momentum signals from the Waddah Attar Forex Scalping Indicator MT4.
The strategy works best on M1 and M5 charts, making it ideal for traders who want to capture quick moves in the market.
It is suitable for both beginner and experienced traders as it provides clear buy and sell signals along with defined risk management.
By combining trend direction and momentum strength, this strategy reduces false entries and improves trading accuracy.
Buy Entry Rules
- Identify a bullish trend when the 50-period MA crosses above the 200-period MA on the 5 MAs Signal indicator.
- Confirm momentum by checking the Waddah Attar histogram. Enter a buy when the histogram turns green and above the signal threshold.
- Place the stop loss just below the recent swing low to limit risk.
- Set take profit at a 1:2 risk-to-reward ratio or target the next resistance level.
Sell Entry Rules
- Identify a bearish trend when the 50-period MA crosses below the 200-period MA on the 5 MAs Signal indicator.
- Confirm momentum by checking the Waddah Attar histogram. Enter a sell when the histogram turns red and exceeds the signal threshold.
- Place the stop loss just above the recent swing high to limit risk.
- Set take profit at a 1:2 risk-to-reward ratio or target the next support level.
Advantages
- Provides clear trend and momentum signals for accurate entries.
- Works on short timeframes like M1 and M5 for fast scalping opportunities.
- Reduces false trades by combining trend confirmation and momentum strength.
- Easy to follow for traders of all levels with minimal guesswork.
Drawbacks
- May produce fewer signals in sideways or choppy markets.
- Short timeframes can be affected by market noise.
- Requires monitoring charts closely for optimal execution.
- Stop loss and take profit levels must be adjusted according to volatility.
Example Case Studies
Case Study 1
On the EUR/USD M5 chart, the 50 MA crossed above the 200 MA, signaling a bullish trend.
The Waddah Attar histogram turned green above the threshold, confirming strong momentum.
A buy was entered at 1.1020 with a stop loss at 1.1005 and take profit at 1.1045.
The trade captured 25 pips within 15 minutes, demonstrating the effectiveness of combining trend and momentum indicators for fast scalping trades.
Case Study 2
On the GBP/USD M1 chart, the 50 MA crossed below the 200 MA, signaling a bearish trend.
The Waddah Attar histogram turned red, confirming strong selling pressure.
A sell entry was placed at 1.3050 with a stop loss at 1.3062 and take profit at 1.3026.
The trade resulted in 24 pips gain in under 10 minutes, highlighting the strategy’s ability to capture quick, profitable moves in volatile markets.
Strategy Tips
- Use multiple timeframes to confirm trend direction. Check M15 or M30 for the overall trend before entering on M1 or M5.
- Only take trades that align with both indicators. Avoid entering if the trend is bullish but momentum is weak, or vice versa.
- Keep a trading journal to track your entries, stop loss levels, and take profit results. This helps identify patterns and improve consistency.
- Consider partial exits if the trade moves quickly. You can close half at the first target and let the rest run for maximum profit.
- Adjust your stop loss dynamically to breakeven once the trade moves in your favor to protect capital.
- Avoid trading during low liquidity hours, such as late New York or Asian sessions, as scalping opportunities may be limited.
- Practice patience. Wait for clear confirmation from both the 5 MAs Signal and Waddah Attar indicators before entering trades.
- Combine this strategy with basic candlestick patterns to improve entry timing, such as pin bars or engulfing candles at support/resistance levels.
Download Now
Download the “carter-ma-indicator.mq4” Metatrader 4 indicator
FAQ
Which of the moving averages in this indicator is the most important?
While all five provide data, the 50 and 200 period moving averages are the most critical for identifying the trend.
Many professional traders look at the “Golden Cross” or “Death Cross” involving these two levels to determine their primary bias.
The faster averages like the 8 and 21 are mostly used to find the best entry price within that larger trend.
How do I handle a sideways market with this system?
In a ranging or sideways market, the moving averages will often cluster together and cross each other frequently.
This is known as “whipsaw” price action.
To avoid losses, it is best to stay out of the market when the 50 and 200 averages are flat and parallel. Only look for trades when these lines show a clear slope up or down.
Does this indicator work on stocks and commodities too?
The 5 MA’s Signal Indicator is highly versatile and works on any instrument available in MT4.
The 50, 100, and 200 period averages are widely watched by institutional traders across all asset classes.
This makes the indicator very reliable for trading gold, oil, and major stock indices alongside forex pairs.
Summary
The 5 MA’s Signal Indicator provides a robust framework for traders who want to master trend-following strategies.
By combining different time horizons into one visual tool, it simplifies the process of market analysis and entry selection.
The clear color-coding ensures that you can quickly interpret the state of the market without being overwhelmed by data.
While the indicator is a standalone system, its performance is enhanced when you use the faster averages for entries and the slower averages for trend direction.
Consistency and patience are key when waiting for the 50 and 200 MA crossovers to align.


