
About the Keltner Channel With Signals indicator
The Keltner Channel With Signals indicator for MT4 converts traditional volatility channels into actionable trading signals.
Instead of just showing upper and lower bands, it generates blue and brown stars directly on the chart for buy and sell opportunities.
A blue star signals a potential buy, while a brown star signals a potential sell.
Traders can quickly spot market reversals and trend continuations without analyzing complex price patterns, making it suitable for scalping, day trading, and swing trading strategies.
Free Download
Download the “keltner-channel-with-signals.mq4” MT4 indicator
Key Features
- Generates blue and brown stars for buy and sell signals directly on the chart.
- Based on Keltner Volatility Channels for trend and volatility analysis.
- Customizable settings allow adjustment of channel and signal sensitivity.
- Provides clear, visual entry and exit guidance to simplify trading.
Indicator Chart
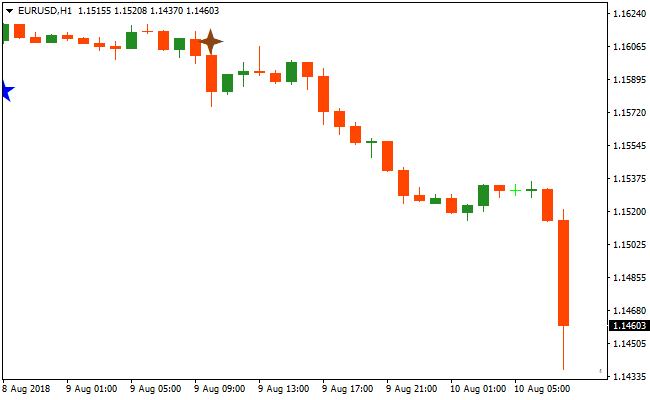
The chart shows the Keltner Channel With Signals indicator in action.
Blue stars appear to indicate buy opportunities, while brown stars indicate sell opportunities.
Traders can immediately see trend direction and volatility-based entry points.
The chart helps identify short-term and longer-term trading opportunities and makes spotting reversals or trend continuations quick and intuitive.
Guide to Trade with Keltner Channel With Signals
Buy Rules
- Wait for a blue star to appear on the chart.
- Open a long position immediately after the blue star forms.
- Ensure the previous price action is trending or moving upward.
Sell Rules
- Wait for a brown star to appear on the chart.
- Open a short position immediately after the brown star forms.
- Check that the prior price action is trending or moving downward.
Stop Loss
- Place stop loss slightly below the recent swing low for buys.
- Place stop loss slightly above the recent swing high for sells.
- Use a trailing stop once the trade moves in your favor to secure profits.
Take Profit
- Close trades when the opposite star appears on the chart.
- Alternatively, exit near nearby support or resistance levels.
- Use a trailing stop to capture extended trends.
Keltner Channel Signals and Vortex Oscillator MT4 Forex Strategy
This MT4 forex strategy combines the Keltner Channel With Signals MT4 Indicator with the Vortex Oscillator Indicator for MT4 to create a trend‑aligned, momentum‑filtered approach for day trading and scalping.
The Keltner Channel indicator prints blue stars for buy trend signals and brown stars for sell trend signals, while the Vortex Oscillator confirms trend direction with its histogram above or below zero.
When both tools align, you take the trade with defined risk and a clear exit plan.
This strategy works well on M5 and M15 time frames and is suited for major currency pairs and liquid cross pairs.
It helps you enter trades when both trend and momentum are aligned, reducing false entries and improving the probability of quick intraday moves.
Buy Entry Rules
- The Keltner Channel indicator prints a blue star indicating a buy trend.
- The Vortex Oscillator histogram is above zero, confirming bullish momentum.
- Enter a buy trade at the close of the candle with the blue star.
- Place the stop loss a few pips below the recent swing low.
- Exit the trade when the histogram drops below zero or when a brown star appears.
Sell Entry Rules
- The Keltner Channel indicator prints a brown star indicating a sell trend.
- The Vortex Oscillator histogram is below zero, confirming bearish momentum.
- Enter a sell trade at the close of the candle with the brown star.
- Place the stop loss a few pips above the recent swing high.
- Exit the trade when the histogram rises above zero or when a blue star appears.
Advantages
- Combines trend signals with momentum confirmation for higher probability setups.
- Visual signals help clarify trade entries and exits on fast charts.
- Adaptable to multiple intraday time frames including M5 and M15.
- Works well with major and liquid cross pairs.
- Helps avoid countertrend scalping by filtering trades that are not in line with momentum.
- Reduces guesswork during entries, making the strategy easy to follow.
- Can be combined with basic support and resistance levels for refinement.
- Provides both entry and exit cues, reducing emotional decisions.
Drawbacks
- Signals may lag slightly after strong impulsive price moves.
- False trend stars can occur during choppy or range‑bound markets.
- Requires quick decision‑making and fast execution on lower time frames.
- Stop losses must be managed carefully in volatile sessions.
Case Study 1
On EURUSD M5 during the London session, the Keltner Channel indicator printed a blue star signaling a buy trend.
Shortly after, the Vortex Oscillator histogram moved above zero confirming bullish momentum.
A long trade was entered at candle close with the stop loss placed below the recent swing low.
Price moved higher with good strength and the trade was exited when the histogram fell below zero, gaining 22 pips in a short time.
Case Study 2
On AUDUSD M15 during the New York session, the Keltner Channel printed a brown star indicating a sell trend.
The Vortex Oscillator histogram confirmed bearish momentum by staying below zero.
A sell trade was entered at the close of the signal candle with the stop loss above the recent swing high.
Price moved lower steadily and the trade was closed when a blue star appeared on the chart, securing 44 pips.
Strategy Tips
- Trade in the direction of the dominant trend on higher time frames to increase the success rate.
- Combine the strategy with recent swing highs and lows to refine stop placement.
- Focus on the most active trading hours for the chosen currency pair to catch stronger moves.
- Limit trades during sideways market conditions when the stars and histogram may give mixed signals.
- Consider partial profit-taking if price reaches a key support or resistance level before the signal flips.
- Keep position sizes small on lower time frames to manage volatility and reduce risk.
- Use alerts for star signals or histogram flips to avoid missing fast moves on lower time frames.
- Be patient and avoid overtrading, focusing only on high-probability setups where both indicators align.
Download Now
Download the “keltner-channel-with-signals.mq4” Metatrader 4 indicator
FAQ
How does the Keltner Channel With Signals indicator differ from standard Keltner Channels?
Instead of just showing volatility bands, it generates clear buy and sell signals on the chart, removing the need to interpret band touchpoints manually.
Can the signal sensitivity be adjusted?
Yes, the indicator’s settings allow you to modify channel width and signal generation to suit fast or slower markets.
How should I combine it with other indicators?
It pairs well with trend or momentum indicators to confirm signals and filter out false entries during low volatility periods.
Summary
The Keltner Channel With Signals indicator transforms traditional volatility bands into actionable buy and sell signals using blue and brown stars.
Its beginner-friendly design makes trend-following and reversal spotting easy for traders of all levels.
By customizing channel width and signal sensitivity, it adapts to any pair, timeframe, or trading style.
Stop loss and take profit methods allow for flexible risk management.
When combined with trend or momentum indicators, it enhances trade accuracy and confidence, making it a practical tool for scalping, day trading, and swing trading.


