
About the RSI MA Signals Oscillator Indicator
The RSI MA Signals Oscillator Metatrader 4 forex indicator is composed of the RSI and moving average trading indicator.
The indicator oscillates between 0 and 100 readings.
Between 0 and 30 readings are considered to be oversold while readings between 70 and 100 are considered to be overbought.
It’s strongly recommended to use it together with a trend following forex indicator.
In up trending markets, wait for the indicator to fall below 30 and then cross back up above 30, this is a signal to go long.
Conversely, in down trending markets, wait for the indicator to rise above 70 and then cross back down below 70, this is a signal to go short.
Use this indicator for scalping, day trading and swing trading.
Free Download
Download the “sgmar.mq4” MT4 indicator
Key Features
- Combines RSI momentum with moving average smoothing.
- Fixed 0 to 100 oscillator range.
- Defined oversold and overbought trigger zones.
- Works across all MT4 timeframes and symbols.
- Supports short-term and higher-timeframe trading.
Indicator Chart
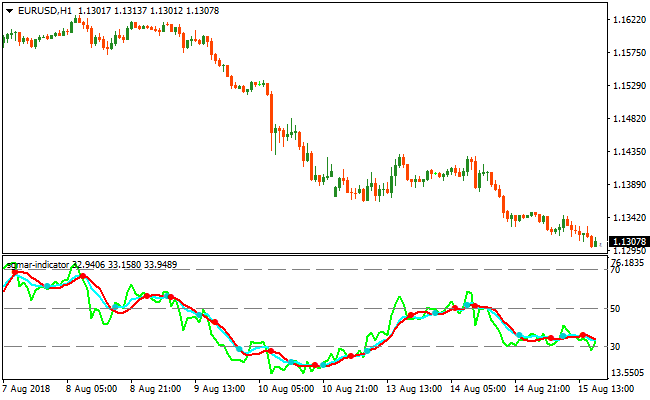
The chart shows the RSI MA Signals Oscillator plotted in a separate window below price action. The oscillator reacts smoothly as price momentum shifts.
Traders use the chart to spot pullbacks within trends and confirm when momentum turns back in the direction of the prevailing move.
Guide to Trade with RSI MA Signals Oscillator Indicator
Buy Rules
- Confirm that the overall market trend is bullish.
- Wait for the oscillator to fall below the 30 level.
- Open a buy trade when the oscillator crosses back above 30.
- Ignore buy signals during bearish trend conditions.
Sell Rules
- Confirm that the overall market trend is bearish.
- Wait for the oscillator to rise above the 70 level.
- Open a sell trade when the oscillator crosses back below 70.
- Avoid sell signals that appear in bullish markets.
Stop Loss
- Set the stop loss beyond a nearby technical barrier.
- Use a wider stop on higher timeframes.
Take Profit
- Close the trade when the oscillator approaches the opposite zone.
- Use a fixed reward-to-risk ratio as an alternative exit.
- Hold trades longer when trend strength remains strong.
RSI MA Signals Oscillator and XTC Forex Trend MT4 Strategy
This MT4 day trading strategy combines the RSI MA Signals Oscillator Metatrader 4 Forex Indicator with the XTC Forex Trend Indicator MT4.
The RSI MA Signals Oscillator identifies oversold and overbought conditions with precise buy and sell signals.
A buy signal occurs when the indicator drops below 30 and then rises back above it, while a sell signal appears when the indicator rises above 70 and then falls below.
The XTC Forex Trend indicator shows a blue histogram for bullish trends and a red histogram for bearish trends.
Combining these indicators allows traders to align entries with the prevailing trend while taking advantage of reversal points in the market.
This strategy is suitable for lower timeframe charts like M5, M15, and M30, making it ideal for day traders looking to capture intraday price swings.
By only taking trades that align with the trend and RSI MA signals, traders can reduce false entries and improve the probability of success.
Buy Entry Rules
- The XTC Forex Trend histogram must be blue, indicating a bullish trend.
- The RSI MA Signals Oscillator must drop below 30 and then rise back above 30.
- Enter a buy trade at the close of the candle confirming the RSI signal while the trend histogram remains blue.
- Place the stop loss below the recent swing low or nearby support level.
- Set take profit near a recent resistance level, previous high, or a fixed target of 20–35 pips depending on the timeframe.
- Close the trade early if the histogram turns red or the RSI MA oscillator reverses back below 30.
Sell Entry Rules
- The XTC Forex Trend histogram must be red, indicating a bearish trend.
- The RSI MA Signals Oscillator must rise above 70 and then fall back below 70.
- Enter a sell trade at the close of the candle confirming the RSI signal while the trend histogram remains red.
- Place the stop loss above the recent swing high or nearby resistance level.
- Set take profit near a recent support level, previous low, or a fixed target of 20–35 pips depending on the timeframe.
- Close the trade early if the histogram turns blue or the RSI MA oscillator reverses back above 70.
Advantages
- Combines trend confirmation with oscillator-based entry points for higher probability trades.
- Easy-to-read visual signals from both indicators reduce hesitation in trade execution.
- Works on multiple lower timeframes, allowing flexibility for day trading strategies.
- Helps traders enter near oversold or overbought levels, increasing the potential for capturing full intraday swings.
- Applicable to a wide range of currency pairs for frequent trading opportunities.
Drawbacks
- Requires monitoring on lower timeframes to ensure timely execution.
- Profit targets may be limited by spread or slippage, especially during fast market conditions.
Case Study 1
On EURJPY M5 during the Asian session, the XTC Forex Trend histogram turned blue, signaling a bullish trend.
The RSI MA Signals Oscillator dipped below 30 and then moved back above it.
A buy trade was initiated and later exited for 24 pips as price approached a previous resistance level, capturing the short-term upward movement effectively.
Case Study 2
On GBPUSD M15 during the London session, the XTC Forex Trend histogram turned red, confirming a bearish trend.
The RSI MA Signals Oscillator rose above 70 and then dropped below it.
A sell trade was opened and subsequently closed for 31 pips when price reached a key support zone, successfully following the intraday downward trend.
Strategy Tips
- Only take trades where the RSI MA signal aligns with the trend histogram to improve trade quality.
- Lower timeframes like M5 provide quick scalping opportunities, while M15 allows capturing slightly larger swings.
- Check higher timeframe trends to confirm the overall market direction before taking trades.
- Adjust stop losses beyond recent swing highs or lows to avoid being stopped out by minor price fluctuations.
- Partial profit-taking near key support or resistance zones can help secure gains while letting the remainder of the trade run.
- Be patient and wait for both trend alignment and oscillator confirmation before entering a trade.
Download Now
Download the “sgmar.mq4” Metatrader 4 indicator
FAQ
How is this oscillator different from standard RSI?
This version integrates moving average logic to smooth RSI behavior. The result is fewer sharp swings and more controlled momentum signals.
Is this indicator better suited for trends or ranges?
It performs strongest in trending markets when signals are filtered by direction. Range-bound conditions require more caution.
Can the settings be adjusted?
Yes, traders can modify RSI periods and smoothing values to better match their preferred timeframe and trading style.
Summary
The RSI MA Signals Oscillator Indicator provides a balanced way to trade momentum without relying on raw RSI readings alone.
Its smoothed behavior helps traders focus on meaningful pullbacks rather than short-lived price spikes.
By combining oversold and overbought zones with directional confirmation, the indicator supports disciplined trend trading across multiple timeframes.
It fits naturally into scalping, day trading, and swing trading strategies.


