
About the Support and Resistance Alert Indicator
The Support and Resistance Alert Indicator for MT4 is a short-term level detection tool designed to help traders identify key price zones where market reactions often occur.
It automatically plots dynamic support and resistance levels on the chart, adapting to recent price action.
These levels act as decision points where price may stall, reverse, or break out with momentum.
By displaying them directly on the chart, the indicator removes the need for manual drawing and constant adjustment, saving time and improving consistency.
A key advantage of this indicator is its built-in alert system.
When price breaks above resistance or below support, a popup alert notifies the trader immediately.
This makes it especially useful for breakout traders who focus on fast-moving market opportunities across multiple pairs and timeframes.
Free Download
Download the “signal-length.mq4” MT4 indicator
Key Features
- Automatically plots short-term support and resistance levels.
- Adjusts levels based on recent market behavior.
- Popup alerts on support or resistance breakouts.
- Works on all MT4 pairs and timeframes.
- Ideal for short-term breakout trading strategies.
Indicator Chart
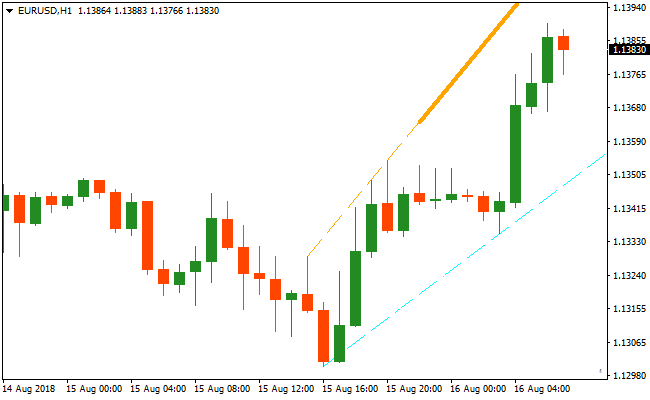
The image below shows the Support and Resistance Alert Indicator plotted directly on the price chart.
Traders monitor these levels to anticipate breakouts and confirm when price closes beyond a key zone, signaling a potential continuation move.
Guide to Trade with Support and Resistance Alert Indicator
Buy Rules
- Wait for price to approach the plotted resistance level.
- Confirm strong bullish pressure near the resistance zone.
- Open a buy trade when price closes above the resistance line.
- Enter only after the candle closes beyond the level.
Sell Rules
- Wait for price to approach the plotted support level.
- Confirm bearish pressure near the support zone.
- Open a sell trade when price closes below the support line.
- Avoid entries before the candle confirms the breakout.
Stop Loss
- Place the stop loss just beyond the broken level.
- Keep the stop on the opposite side of the breakout zone.
Take Profit
- Close the trade when price reaches the next key level.
- Exit if price fails to follow through after the breakout.
- Trail the stop once price moves decisively in your favor.
- Let strong breakouts run while momentum holds.
Support and Resistance Alert MT4 and Lucky Reversal Indicator Forex Strategy
This MT4 forex strategy combines breakout signals from the Support and Resistance Alert Metatrader 4 Forex Indicator with trend reversal confirmation from the Lucky Reversal Indicator MT4.
The Support and Resistance Alert helps identify bullish breakout opportunities when price closes above resistance and bearish breakouts when price closes below support.
The Lucky Reversal Indicator provides additional entry confirmation with blue arrows signaling bullish reversals and red arrows signaling bearish reversals.
Using both indicators together improves trade accuracy by aligning breakout momentum with potential trend reversals.
This strategy is suitable for day trading on M5, M15, and H1 charts.
It is great for traders who prefer a combination of breakout and reversal strategies, capturing both short-term price moves and early trend reversals.
By waiting for both indicators to align, traders can filter out weaker setups and focus on high-probability trades.
Buy Entry Rules
- Price must close above a resistance line on the Support and Resistance Alert indicator.
- The Lucky Reversal Indicator must display a blue arrow signaling a bullish trend reversal.
- Enter a buy trade at the close of the candle confirming the breakout and reversal signal.
- Place the stop loss below the nearest support level or below the breakout candle.
- Set the take profit near the next resistance area or a predefined target based on the timeframe.
- Close the trade early if a red reversal arrow appears or if price falls back below the breakout level.
Sell Entry Rules
- Price must close below a support line on the Support and Resistance Alert indicator.
- The Lucky Reversal Indicator must display a red arrow signaling a bearish trend reversal.
- Enter a sell trade at the close of the candle confirming the breakout and reversal signal.
- Place the stop loss above the nearest resistance level or above the breakout candle.
- Set the take profit near the next support area or a predefined target based on the timeframe.
- Close the trade early if a blue reversal arrow appears or if price rises back above the breakout level.
Advantages
- Combines breakout and reversal strategies for higher probability trades.
- Simple signals make spotting trade opportunities straightforward.
- Effective across multiple timeframes, allowing flexibility for different trading styles.
- Dynamic stop loss placement protects against sudden reversals while allowing room for trend continuation.
- Suitable for both novice and experienced traders due to simple, rule-based entries.
Drawbacks
- Requires close attention on lower timeframes to react quickly to reversal signals.
- Profit targets may be affected by spreads or slippage on fast-moving pairs.
Case Study 1
On AUDCAD M5 during the London session, price closed above a resistance line and the Lucky Reversal indicator displayed a blue arrow.
A buy trade was entered and later closed for 24 pips when price reached the next resistance level and a red reversal arrow appeared, successfully capturing the breakout and continuation of the bullish move.
Case Study 2
On GBPUSD M15 during the New York session, price closed below a support line and the Lucky Reversal indicator displayed a red arrow.
A sell trade was placed and concluded for 32 pips when price approached the next support area and a blue reversal arrow formed, effectively following the intraday downtrend.
Strategy Tips
- Focus on trades where the breakout closes decisively beyond the support or resistance level and the reversal arrow confirms the move.
- Use lower timeframes like M5 for fast intraday scalping and M15 or H1 for more stable breakout trades.
- Always check higher timeframe trends to ensure you are trading in the overall market direction.
- Be selective with entries; avoid trading minor breakouts that occur in choppy or low-volume conditions.
- Adjust stop losses dynamically near swing highs and lows to reduce the chance of premature exits.
- Consider taking partial profits at key support or resistance zones while allowing part of the position to capture extended moves.
- Do not enter trades just before major economic news to reduce the risk of volatility spikes affecting the trade.
- Keep track of currency pairs and session times that consistently provide stronger breakout-reversal setups.
- Be patient and wait for full confirmation of both the breakout and reversal signal to maximize the probability of success.
Download Now
Download the “signal-length.mq4” Metatrader 4 indicator
FAQ
What type of trader benefits most from this indicator?
This indicator is ideal for short-term traders who focus on breakouts rather than reversals. It suits scalpers and intraday traders especially well.
Are the support and resistance levels static?
No, the levels adjust dynamically as new price data forms. This keeps the indicator aligned with current market conditions.
Do alerts trigger on candle close or intrabar movement?
Alerts are designed to trigger when price breaks through a level, helping traders react quickly to confirmed breakouts.
Can this indicator be combined with trend tools?
Yes, many traders combine it with trend-following indicators to trade breakouts only in the direction of the broader trend.
Summary
The Support and Resistance Alert Indicator provides traders with a practical way to identify and trade short-term breakout opportunities.
Plotting adaptive support and resistance levels automatically removes subjectivity from level analysis.
The built-in alert system allows traders to stay informed without watching the charts constantly, making it suitable for monitoring multiple markets at once.
This feature is especially useful during active trading sessions.


