
About the Spectrometer Indicator
The Spectrometer Indicator for MT4 is a precision momentum tool designed to track market velocity through a series of oscillating colored lines.
Displayed in a separate window below the activity chart, it measures price strength between the values of 0.04 and -0.04.
This indicator serves as a professional-grade filter, helping traders identify the exact moment momentum shifts from bearish to bullish or vice versa.
By focusing on the interaction between the indicator lines and the central zero threshold, it provides an objective view of market sentiment that is often hidden on the main price chart.
This indicator is particularly effective at catching the early stages of a new trend.
The core of the system relies on the thick red line, which acts as the primary signal generator.
When this line moves across the zero mark, it indicates a fundamental change in the balance of power between buyers and sellers.
Free Download
Download the “spectrometer.mq4” MT4 indicator
Key Features
- Monitors market velocity using a dedicated oscillator window with a 0.04 to -0.04 range.
- Features a thick red signal line for clear identification of momentum crossovers.
- Provides a neutral zero-line reference to distinguish between bullish and bearish environments
Indicator Chart
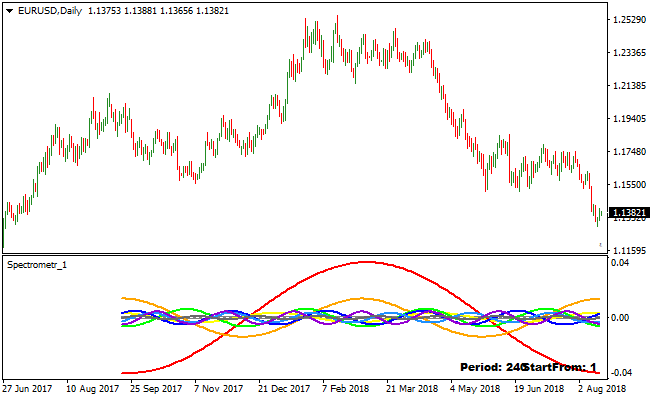
The Spectrometer Indicator populates a sub-window with multiple colored lines that fluctuate around a central zero point.
The most critical component is the thick red line, which provides the primary triggers for trade entries.
When the red line resides above the zero mark, the market bias is considered bullish.
When it drops below the zero mark, the bias shifts to bearish.
Guide to Trade with Spectrometer Indicator
Buy Rules
- Observe the thick red Spectrometer line as it moves below the zero mark.
- Wait for the red thick line to cross above the zero level from below.
- Confirm the signal by ensuring the price is showing signs of bullish rejection on the main chart.
- Initiate a long trade once the crossover is confirmed on a closed candle.
Sell Rules
- Monitor the thick red Spectrometer line as it oscillates above the zero mark.
- Watch for the red thick line to cross below the zero level from above.
- Verify that the bearish momentum is increasing as the line extends further into negative territory.
- Execute a short trade immediately following the downward zero-line breach.
Stop Loss
- For buy positions, set a stop loss slightly below the most recent swing low or local support level.
- For sell positions, place the stop loss a few pips above the previous swing high or resistance area.
- Alternatively, use a fixed pip-based stop that aligns with the average daily range of the currency pair.
Take Profit
- Target a profit level near the next significant technical zone or psychological round number.
- Consider closing the position if the thick red line begins to curl back aggressively toward the zero mark.
- Utilize a trailing stop to protect gains as the indicator reaches the outer 0.04 or -0.04 extremes.
Spectrometer and Multiple Days Pivot Point Forex Day Trading Strategy for MT4
This MT4 day trading strategy combines momentum signals from the Spectrometer Metatrader 4 Forex Indicator with market structure guidance from the Multiple Days Pivot Point Indicator MT4.
The Spectrometer helps you identify bullish and bearish momentum shifts when its red thick line crosses the zero level.
The pivot point indicator shows whether price is trading above the pivot (bullish) or below the pivot (bearish).
By combining these two, traders can focus on high-probability intraday moves with momentum on their side.
This strategy works best on M5, M15, and H1 charts.
It is especially useful for day traders who want clear, objective entry and exit rules based on trend context and momentum shifts.
Beginners can follow the simple crossover and pivot rules, while experienced traders can refine entries and exits using price action around key levels.
Buy Entry Rules
- Price must be trading above the Multiple Days Pivot Point, confirming bullish market structure.
- The Spectrometer red thick line must cross above the zero level from below, signaling bullish momentum.
- Enter a buy trade at the close of the candle where the Spectrometer crossover occurs and price remains above the pivot.
- Place the stop loss just below the nearest support level, recent swing low, or pivot support.
- Set the take profit at the next significant resistance level or use a fixed target such as 10–25 pips depending on the timeframe.
- Close the trade early if the Spectrometer crosses back below zero or price closes below the pivot point.
Sell Entry Rules
- Price must be trading below the Multiple Days Pivot Point, confirming bearish market structure.
- The Spectrometer red thick line must cross below the zero level from above, signaling bearish momentum.
- Enter a sell trade at the close of the candle where the Spectrometer crossover occurs and price remains below the pivot.
- Place the stop loss just above the nearest resistance level, recent swing high, or pivot resistance.
- Set the take profit at the next significant support level or use a fixed target based on the timeframe.
- Close the trade early if the Spectrometer crosses back above zero or price closes above the pivot point.
Advantages
- The strategy combines momentum and market pivot points, helping to filter out weak signals and focus on higher probability trades.
- Works on lower timeframes like M5 and M15 for quick intraday opportunities and H1 for more structured moves.
- Clear entry and exit rules make it easy to follow for both novice and experienced traders.
- Pivot points provide logical support and resistance levels to set stops and profit targets.
Drawbacks
- Signals can be less reliable during low volatility or sideways markets where momentum is weak.
- Pivot levels may not hold in highly volatile conditions, causing false breakouts.
- Overtrading can occur if rules are not strictly followed, especially on lower timeframes.
Case Study 1
On EURAUD M15 during the London session, price was trading above the pivot point, indicating a bullish structure.
The Spectrometer red line crossed above zero from below, signaling bullish momentum.
A buy trade was entered and later closed for 37 pips when price approached the next resistance level and the Spectrometer began weakening, effectively capturing the intraday upward move.
Case Study 2
On GBPJPY M5 during the New York session, price was below the pivot point, confirming bearish market conditions.
The Spectrometer red thick line crossed below the zero level, signaling bearish momentum.
A sell trade was initiated and later closed for 29 pips when price reached the next visible support zone as the Spectrometer showed signs of reversing, capturing the intraday downward move.
Strategy Tips
- Focus on trades where both pivot point structure and Spectrometer momentum align for higher probability signals.
- Use M5 for quick scalps, M15 for balanced intraday entries, and H1 for more sustained moves within the session.
- Place stop losses just beyond recent swing highs or lows to protect against sudden price spikes.
- Consider partial profit-taking near key support or resistance levels and then let the rest run if momentum remains strong.
- Use the pivot framework to help identify potential reversal areas as well as trend continuation setups.
Download Now
Download the “spectrometer.mq4” Metatrader 4 indicator
FAQ
How do the 0.04 and -0.04 values help in trading?
These outer limits represent areas of extreme momentum.
When the Spectrometer Indicator reaches these levels, it suggests the current move is very strong but may also be approaching an overextended state.
Can the Spectrometer Indicator be used with trend filters?
Yes, it is highly recommended.
Combining this tool with a higher-timeframe moving average allows you to only take crossovers that align with the major trend.
Summary
The Spectrometer Indicator is a robust utility for identifying momentum shifts with institutional precision.
By simplifying complex price data into a zero-line oscillator, it removes the guesswork from trend timing.
Its strength lies in its ability to highlight the transition from a quiet market into a high-momentum expansion phase.
For the best results, use these signals as a primary trigger within a disciplined trading framework.
By waiting for the thick red line to cross the zero mark, you ensure that your trades are backed by real market velocity.


