
About the Trend Signal Trader indicator
The Trend Signal Trader indicator for MetaTrader 4 is a versatile technical tool designed to simplify trend identification by plotting direct entry signals on the price chart.
When a shift in sentiment occurs, the indicator generates trading signals in the form of colored arrows, allowing traders to react quickly to new opportunities.
It is built to serve both short-term scalpers and long-term swing traders by adapting its logic to various chart periodicities.
It helps users avoid the risks of trading against the market flow, providing a more disciplined approach to entries and exits in the foreign exchange market.
Free Download
Download the “trendsignal.mq4” MT4 indicator
Key Features
- Direct on-chart arrow signals for immediate visual recognition.
- Dual-color coding with blue for bullish momentum and magenta for bearish shifts.
- Advanced filtering logic to reduce false signals during periods of low volatility.
- Fully adjustable input parameters to fine-tune signal frequency and sensitivity.
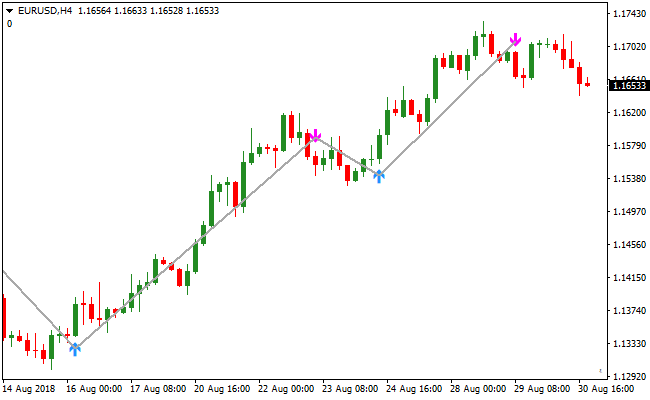
Indicator Chart
The Trend Signal Trader indicator chart displays blue and magenta arrows at key trend turning points.
The image illustrates how the indicator provides a buy signal through a blue arrow and a sell signal through a magenta arrow as the trend develops.
Guide to Trade with the Trend Signal Trader indicator
Buy Rules
- Monitor the price chart for the appearance of a blue arrow.
- Ensure the blue arrow appears at the base of a potential upward move.
- Confirm that the overall market sentiment aligns with a bullish outlook.
- Enter a long position at the opening of the candle following the blue arrow signal.
Sell Rules
- Wait for the Trend Signal Trader indicator to plot a magenta arrow on the chart.
- Verify that the magenta arrow coincides with a peak or a break in support.
- Check that no major news events are likely to cause immediate trend reversals.
- Open a short position immediately after the signal candle has closed.
Stop Loss
- Place the stop loss a few pips below the most recent swing low for buy trades.
- Set the stop loss a few pips above the most recent swing high for sell trades.
- Utilize a dynamic stop loss that moves with the trend to protect your capital.
Take Profit
- Exit the trade when an opposite colored arrow appears on the chart.
- Target the next major horizontal support or resistance level as a primary goal.
- Consider closing a portion of the position after a specific number of pips..
Trend Signal Trader and Hyper Bollinger Band Forex Strategy for MT4
This MT4 forex strategy combines precise entry signals from the Trend Signal Trader indicator with dynamic trend filtering from the Hyper Bollinger Band indicator.
The strategy is designed to trade in the direction of strong market momentum while avoiding low probability entries during sideways conditions.
The Trend Signal Trader indicator provides buy and sell arrows that highlight potential entry points.
Blue arrows indicate buy opportunities, while magenta arrows indicate sell opportunities.
These signals become far more reliable when combined with the Hyper Bollinger Band, which defines trend direction based on the slope of its bands.
The Hyper Bollinger Band indicator helps identify whether the market is trending or ranging.
When the bands slope upward, bullish momentum dominates. When the bands slope downward, bearish momentum controls the market.
By aligning arrow signals with band direction, this strategy focuses only on trades with strong directional bias.
This strategy works well on M15, M30, and H1 timeframes.
It is suitable for traders who prefer structured trend trading with clear confirmation rules.
It performs best on major and minor currency pairs during active market sessions.
Buy Entry Rules
- The Hyper Bollinger Band must be clearly sloping upward, confirming bullish market conditions.
- The Trend Signal Trader indicator must display a blue arrow on the chart.
- Enter the buy trade at the close of the candle where the blue arrow appears.
- Stop loss is placed below the most recent swing low or below the lower Hyper Bollinger Band.
- Take profit is set near the next resistance zone or when the Hyper Bollinger Bands begin to flatten.
Sell Entry Rules
- The Hyper Bollinger Band must be clearly sloping downward, confirming bearish market conditions.
- The Trend Signal Trader indicator must display a magenta arrow on the chart.
- Enter the sell trade at the close of the candle where the magenta arrow appears.
- Stop loss is placed above the most recent swing high or above the upper Hyper Bollinger Band.
- Take profit is set near the next support zone or when the Hyper Bollinger Bands begin to flatten.
Advantages
- Combines directional volatility analysis with precise entry timing for higher quality trades.
- Filters out many false signals by requiring clear trend confirmation from the band slope.
- Visual arrow signals reduce hesitation and improve execution speed.
- Adapts well to changing market volatility without complex settings.
- Works consistently across different timeframes and currency pairs.
Drawbacks
- Entry signals can appear late after strong impulsive price moves.
- Requires trader discretion to correctly judge band slope strength.
- Lower trade frequency compared to aggressive scalping strategies.
Case Study 1
On CADJPY H1 during the London session, the Hyper Bollinger Bands were clearly sloping upward, indicating bullish conditions.
After a brief consolidation, a blue arrow appeared from the Trend Signal Trader indicator.
A buy trade was entered at candle close. The stop loss was placed below the recent swing low.
Price continued higher and the trade was closed near a resistance area as the bands began to flatten, capturing approximately 67 pips.
Case Study 2
On EURCHF M30 during the New York session, the Hyper Bollinger Bands were sloping downward, confirming bearish momentum.
Following a minor pullback, the Trend Signal Trader printed a magenta arrow.
A sell position was opened at confirmation. The stop loss was set above the recent swing high.
Price declined steadily and the trade was exited near support when the bands lost slope, securing around 41 pips.
Strategy Tips
- Trade only when the Hyper Bollinger Band slope is clearly directional.
- Avoid entries when the bands are flat or tightly compressed.
- Use arrow signals as confirmation, not as standalone trade decisions.
- Allow trades to run while the bands maintain their slope.
- Confirm entries on candle close to avoid false signals.
Download Now
Download the “trendsignal.mq4” Metatrader 4 indicator
FAQ
Can I change the sensitivity of the arrows in the settings?
Yes, you can access the inputs tab of the Trend Signal Trader indicator to modify its core values.
Increasing the period will result in fewer but more reliable signals, while decreasing it will provide more frequent signals suited for fast-paced scalping environments.
How should I handle signals that appear during a sideways market?
In a ranging or sideways market, any trend-following tool can produce false signals.
It is best to wait for a clear breakout of the range or use the Trend Signal Trader indicator in conjunction with a volume filter to ensure there is enough momentum to sustain a new trend.
Summary
The Trend Signal Trader indicator stands out as a reliable and user-friendly solution for traders who prefer visual simplicity.
By following its trend-based signals, you can maintain a high level of consistency in your trading routine.
The flexibility to adjust its sensitivity ensures it remains relevant across different market conditions and asset classes.
While it provides strong standalone signals, its usability is maximized when incorporated into a broader trading plan that includes proper risk management.


