
About the Trix Trend Cycle indicator
The TRIX Trend Cycle MetaTrader 4 forex indicator is a popular trading oscillator used by many currency traders.
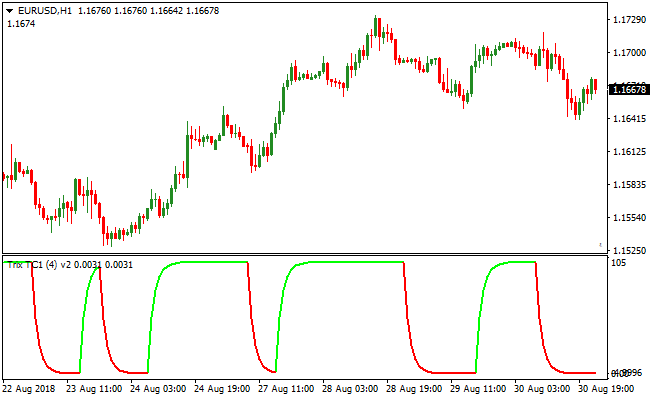
TRIX oscillates between 0 and 105 in a separate MetaTrader 4 indicator window.
An indicator reading at 0 is considered oversold, while a reading at 105 is considered overbought.
To achieve better trading results with TRIX, it should be used together with a trend-following indicator such as a simple moving average or an exponential moving average.
Always trade in the direction of the underlying trend as identified by the trend-following indicator.
When price action is above the trend-following indicator, only trade TRIX oversold signals found at the 0 level.
When price action is below the trend-following indicator, only trade TRIX overbought signals found at the 105 level.
The default TrixPeriod value is set to 4 but can be changed directly from the indicator’s Inputs tab.
Adjusting this setting allows you to better fit the indicator to your needs.
TRIX can be used for scalping, day trading, and swing trading.
Free Download
Download the “trix-trend-cycle.ex4” MT4 indicator
Key Features
- Triple smoothing technology to eliminate market noise and erratic spikes.
- Cycle-based calculations that identify recurring market patterns.
- Fast response to momentum changes for timely entry and exit points.
- Highly readable oscillator line for clear trend identification.
- Customizable input parameters to suit various asset classes and volatilities.
- Works seamlessly across all timeframes from scalping to long-term investing.
Indicator Chart
The Trix Trend Cycle indicator chart displays a smooth oscillator line that tracks the momentum of the market.
You can see how the line changes direction to signal the start of a new bullish or bearish trend cycle.
Guide to Trade with the Trix Trend Cycle indicator
Buy Rules
- Monitor the Trix Trend Cycle indicator for a bottoming formation.
- Wait for the oscillator line to turn upward from its lower extreme.
- Confirm that the price action supports a bullish reversal.
- Enter a long position once the upward slope is clearly established on a closed candle.
Sell Rules
- Watch for the Trix Trend Cycle indicator to peak at its upper extreme.
- Wait for the oscillator line to turn downward, indicating fading momentum.
- Verify the bearish shift with a rejection at a resistance level.
- Open a short position as the indicator begins its downward cycle.
Stop Loss
- Place your stop loss below the most recent local support for buy orders.
- Set the stop loss above the most recent local resistance for sell orders.
- Adjust the stop distance to account for the average true range of the pair.
- Ensure the stop level provides enough room for minor retracements.
Take Profit
- Exit the trade when the indicator line reaches the opposite extreme zone.
- Consider taking profit if the slope of the oscillator begins to flatten significantly.
- Target the next major psychological level or structural pivot point.
- Use a trailing stop to protect capital as the trend cycle matures.
TRIX Trend Cycle and Heiken Ashi Smoothed Forex Strategy for MT4
This MT4 forex strategy combines momentum cycle confirmation from the TRIX Trend Cycle indicator with clear trend direction from the Heiken Ashi Smoothed Alerts indicator.
The strategy is designed to enter trades at the early stages of trend continuation after momentum resets, allowing traders to participate in sustained market moves with controlled risk.
The TRIX Trend Cycle indicator identifies momentum cycles and signals when price is ready to resume movement after a correction.
By waiting for the indicator to reach key levels and then change color, the strategy avoids premature entries.
The Heiken Ashi Smoothed indicator simplifies trend analysis by filtering market noise and displaying smooth candle colors that reflect the dominant direction.
This strategy works best on M15, M30, and H1 timeframes.
It is suitable for traders who prefer structured trend trading with confirmation from both price direction and momentum behavior.
The strategy performs well on major and cross currency pairs with consistent volatility.
Buy Entry Rules
- The Heiken Ashi Smoothed indicator must display blue candles, confirming a bullish trend.
- The TRIX Trend Cycle indicator must first reach the 0 level.
- A buy signal is confirmed when the TRIX indicator draws a green line after touching the 0 level.
- Enter the buy trade at the close of the candle where the green TRIX line is confirmed.
- Stop loss is placed below the most recent swing low or below the Heiken Ashi bullish structure.
- Take profit is set near the next resistance zone or when the Heiken Ashi candles change from blue to pink.
Sell Entry Rules
- The Heiken Ashi Smoothed indicator must display pink candles, confirming a bearish trend.
- The TRIX Trend Cycle indicator must first reach the 105 level.
- A sell signal is confirmed when the TRIX indicator draws a red line after touching the 105 level.
- Enter the sell trade at the close of the candle where the red TRIX line is confirmed.
- Stop loss is placed above the most recent swing high or above the Heiken Ashi bearish structure.
- Take profit is set near the next support zone or when the Heiken Ashi candles change from pink to blue.
Advantages
- Combines momentum cycle timing with clear trend direction.
- Helps traders enter trends after corrective phases.
- Smooth candle filtering reduces market noise.
- Adaptable to different market conditions and currency pairs.
- Exit logic follows price structure rather than fixed targets.
Drawbacks
- Signals may appear less frequently during strong impulsive trends.
- Requires patience to wait for TRIX level interaction.
- Effectiveness decreases during low volatility or sideways markets.
- Not designed for very fast scalping strategies.
Case Study 1
On NZDJPY H1 during the Asian session, the Heiken Ashi Smoothed candles remained blue, indicating sustained bullish momentum.
Price retraced moderately and the TRIX Trend Cycle indicator moved down toward the 0 level.
Once the indicator reached 0 and then turned green, a buy trade was entered at candle close.
The stop loss was placed below the recent swing low.
Price resumed higher and the trade was closed near resistance when Heiken Ashi candles shifted color, capturing approximately 92 pips.
Case Study 2
On EURAUD M30 during the London session, the Heiken Ashi Smoothed candles turned pink, confirming bearish conditions.
After a corrective bounce, the TRIX Trend Cycle indicator climbed toward the 105 level.
When it reached this level and then printed a red line, a sell position was opened.
The stop loss was set above the recent swing high.
Price continued lower and the position was exited near support as candle color changed, securing around 57 pips.
Strategy Tips
- Trade only in the direction indicated by the Heiken Ashi Smoothed candle colors.
- Use the TRIX Trend Cycle indicator strictly for timing entries after pullbacks.
- Wait for candle close confirmation to avoid early or false signals.
- Mark key support and resistance zones to guide take profit placement.
- Allow trades to run while candle color remains aligned with the trend.
- Focus on active market sessions for cleaner price movement.
Download Now
Download the “trix-trend-cycle.ex4” Metatrader 4 indicator
FAQ
What makes the Trix Trend Cycle indicator different from a standard Trix?
This version incorporates cycle-specific logic to better align with the natural ebb and flow of the markets.
The Trix Trend Cycle indicator emphasizes the completion of price swings, making it more effective at identifying exhaustion points in a trend.
Can I use this tool to trade divergences?
Yes, many professional traders use the Trix Trend Cycle indicator to spot divergences between price and momentum.
If price makes a new high but the indicator makes a lower peak, it often signals a weakening trend and a high-probability reversal setup.
Which settings should I use for day trading?
For day trading on the M15 or H1 charts, you can slightly decrease the period settings in the inputs tab.
This increases the sensitivity of the Trix Trend Cycle indicator, allowing it to respond faster to the intraday cycles that occur during the London and New York sessions.
Summary
The Trix Trend Cycle indicator is an excellent choice for traders who value smooth, reliable data over the constant fluctuations of raw price action.
Its unique triple-smoothed calculation provides a level of clarity that helps in maintaining discipline during volatile market phases.
While it is powerful as a primary signal generator, its usability is further enhanced when used to confirm price action patterns.


