About the Double CCI Woody Indicator
The Double CCI Woody indicator for MT4 is a powerful trend and momentum tool based on the Commodity Channel Index.
It oscillates above and below the zero line, signaling bullish momentum above zero and bearish momentum below zero.
The indicator displays blue and red zones in a separate window beneath the main chart.
Blue zones represent bullish trends while red zones represent bearish trends.
A signal line overlays these zones, helping traders pinpoint optimal buy and sell entries.
Traders can use the Double CCI Woody as a standalone indicator or combine it with other technical tools for confirmation.
Its design helps to identify trend direction and momentum at a glance.
Using it with trend confirmation indicators or support/resistance analysis improves signal quality.
The indicator is flexible and can be applied to any currency pair and timeframe.
Free Download
Download the “double-cci-woody.mq4” MT4 indicator
Key Features
- Displays bullish and bearish zones using blue and red colors.
- Oscillates above and below zero to indicate trend direction.
- Includes a signal line for entry timing.
- Helps identify trend continuation and pullback entries.
Indicator Chart
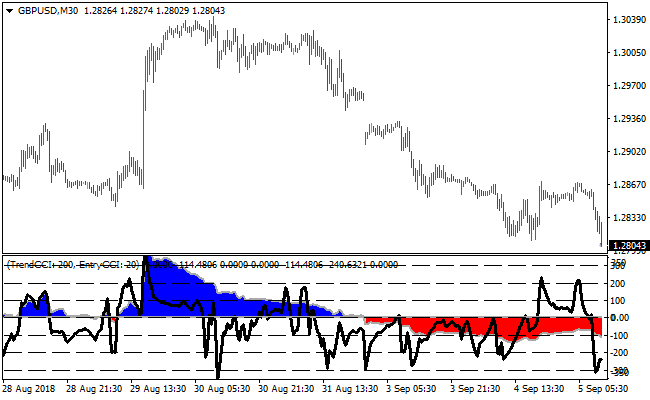
The Double CCI Woody indicator appears in a separate window under price action.
Blue zones show bullish momentum while red zones show bearish momentum.
The signal line highlights precise entry points for trades that align with the prevailing trend.

Guide to Trade with the Double CCI Woody Indicator
Buy Rules
- Open a buy trade when the indicator paints a blue trading zone.
- Alternatively, go long when the signal line crosses back above 0.00 while a blue zone is active.
- Confirm the trend direction using a secondary trend indicator or moving averages.
- Only take trades in the direction of the prevailing trend.
Sell Rules
- Open a sell trade when the indicator paints a red trading zone.
- Alternatively, go short when the signal line crosses back below 0.00 while a red zone is active.
- Confirm the trend using a trend-following tool or chart patterns.
- Trade only in the direction of the prevailing bearish momentum.
Stop Loss
- For buy trades, place a stop loss just below the bottom of the current blue zone or below recent support.
- For sell trades, place a stop loss just above the top of the red zone or above recent resistance.
Take Profit
- Close buy trades near the next significant resistance or when the signal line turns downward.
- Close sell trades near the next major support or when the signal line turns upward.
Double CCI Woody and Auto Channel MT4 Forex Scalping Strategy
This MT4 scalping strategy combines the trend confirmation of the Auto Channel MT4 Forex Indicator with the precise entry timing of the Double CCI Woody MT4 Forex Indicator.
It is designed for traders who want fast, short-term trades using clear visual cues on M1 and M5 charts.
The Auto Channel indicator plots dynamic channels on the chart.
An upward sloping channel indicates bullish conditions and suggests looking for buy trades, while a downward sloping channel indicates bearish conditions and suggests looking for sell trades.
The Double CCI Woody indicator provides histogram signals for precise entries.
A blue histogram signals a buy opportunity and a red histogram signals a sell opportunity.
Combining these two indicators ensures trades align with the prevailing trend while timing entries accurately.
This strategy works best on major currency pairs and gold during active market sessions.
It is suitable for scalpers who want a simple yet effective method to trade short-term momentum.
Buy Entry Rules
- The Auto Channel must be sloping upwards, confirming a bullish trend.
- Open the chart of the selected pair and apply the Double CCI Woody indicator.
- Wait for the blue histogram to appear on the Double CCI Woody.
- Enter a buy trade at the close of the candle where the blue histogram appears.
- Place the stop loss below the most recent swing low or the lower boundary of the channel.
- Keep the trade open while the channel remains upward and the histogram stays blue.
- Close the trade immediately if the histogram turns red or the channel slope reverses downward.
Sell Entry Rules
- The Auto Channel must be sloping downward, confirming a bearish trend.
- Open the chart of the selected pair and apply the Double CCI Woody indicator.
- Wait for the red histogram to appear on the Double CCI Woody.
- Enter a sell trade at the close of the candle where the red histogram appears.
- Place the stop loss above the most recent swing high or the upper boundary of the channel.
- Keep the trade open while the channel remains downward and the histogram stays red.
- Close the trade immediately if the histogram turns blue or the channel slope reverses upward.
Advantages
- Combines trend-following with precise entry signals for higher probability trades.
- Effective for short-term scalping on M1 and M5 charts.
- Helps avoid countertrend trades using the Auto Channel as a filter.
- Applicable to multiple currency pairs and gold without adjustments.
Drawbacks
- Requires constant monitoring of charts for timely entries and exits.
- Channel slope and histogram reversals can result in early exits or whipsaws.
- Overtrading can occur if signals are not filtered properly.
Case Study 1
On EURUSD M5 during the London session, the Auto Channel sloped upward, indicating a bullish trend.
The Double CCI Woody indicator displayed a blue histogram after a minor pullback.
A buy trade was entered and held while both the channel remained upward and the histogram stayed blue.
When the histogram turned red, the trade was closed, capturing a strong intraday upward move.
Case Study 2
On GBPJPY M1 during the New York session, the Auto Channel sloped downward, confirming a bearish trend.
The Double CCI Woody indicator showed a red histogram after a short consolidation.
A sell trade was opened and maintained while both indicators confirmed the downtrend.
When the histogram turned blue and the channel slope flattened, the trade was closed, securing an intraday profit.
Strategy Tips
- Trade only in the direction of the channel slope to ensure alignment with the main trend.
- Enter trades when the Double CCI Woody histogram confirms the trend for higher probability setups.
- Focus on major currency pairs and gold during high volatility sessions for stronger price movements.
- Avoid trading during periods of low liquidity or around major economic news to reduce whipsaw risk.
- Use recent swing highs and lows or the channel boundaries to place stops safely and protect your account.
- Close trades immediately when the histogram changes color or the channel slope reverses to lock in profits.
- Wait for small pullbacks before entering trades to improve timing and avoid entering at overextended levels.
- Keep a trading journal to track which pairs and timeframes perform best with this strategy for continuous improvement.
Download Now
Download the “double-cci-woody.mq4” Metatrader 4 indicator
FAQ
How does the signal line improve entry timing?
The signal line helps pinpoint exact moments when momentum aligns with the trend.
Traders can use it to enter trades on pullbacks or trend continuation points for better precision.
Can this indicator work for range-bound markets?
It’s primarily designed for trending markets, but traders can use zone crossovers cautiously in range conditions.
Confirming with support/resistance levels is recommended in choppy markets.
What is the benefit of using zones and signal line together?
The colored zones show the overall trend, while the signal line highlights the optimal entry points within the trend.
This combination reduces false entries and improves trade accuracy.
Summary
The Double CCI Woody indicator provides blue and red zones with a signal line to highlight momentum and trend direction.
It simplifies identifying buy and sell opportunities within prevailing trends.
The combination of zones and the signal line makes entries easy to spot and trade efficiently.


