
About the Bykov Trend Signals Indicator
The Bykov Trend Signals indicator for MT4 uses the Bykov formula to display trend-following buy and sell arrows directly on the chart.
Aqua arrows signal potential long trades, while magenta arrows indicate short trade opportunities.
The default SSP setting is 5, but increasing it to 50 or higher produces slower, more reliable signals suitable for stand-alone use.
This indicator works well across multiple timeframes: M5 and M15 for scalping and day trading, and H1, H4, and D1 for swing trading.
Signals are easy to interpret, and trades can be exited either when an opposite arrow appears or using a trader’s own exit strategy.
Free Download
Download the “bykovtrend-sig.mq4” MT4 indicator
Key Features
- Shows aqua buy arrows and magenta sell arrows directly on the chart.
- Trend-following indicator with adjustable SSP setting for speed vs. reliability.
- Works across scalping, day trading, and swing trading timeframes.
- Signals are simple and easy to interpret for quick decisions.
- Flexible exit strategies: opposite arrow or personal trade management.
Indicator Chart
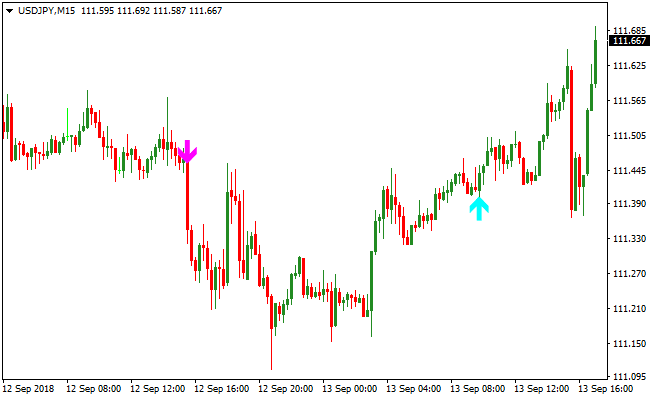
The chart displays the Bykov Trend Signals indicator in action.
Aqua arrows indicate buy opportunities, while magenta arrows indicate sell opportunities.
Traders can quickly follow the trend and enter trades in the arrow direction.
Adjusting the SSP setting can fine-tune signal frequency and reliability.
Guide to Trade with Bykov Trend Signals
Buy Rules
- Enter a buy trade when an aqua arrow appears on the chart.
- Confirm the overall trend with higher timeframe analysis or moving averages.
- For scalping, use M5 or M15 during London or New York sessions.
- Avoid buying if a magenta arrow appears or trend shows strong bearish conditions.
Sell Rules
- Enter a sell trade when a magenta arrow appears on the chart.
- Confirm the overall trend with higher timeframe analysis or moving averages.
- For swing trades, use H1, H4, or D1 charts for more reliable entries.
- Avoid selling if an aqua arrow appears or trend shows strong bullish conditions.
Stop Loss
- Place the stop loss a few pips beyond the signal arrow in the opposite direction.
- Below the aqua arrow for buys, above the magenta arrow for sells.
Take Profit
- Close buy trades when a magenta arrow appears or price reaches nearby resistance.
- Close sell trades when an aqua arrow appears or price reaches nearby support.
Bykov Trend Signals and Zero Lag Moving Average Strategy MT4
This MT4 trading strategy uses the Bykov Trend Signals Indicator to provide entry arrows and the Zero Lag Moving Average Indicator to filter trend direction.
The strategy focuses on taking trades that align with the prevailing trend.
When price stays above the Zero Lag Moving Average, the trend is bullish and only buy signals are taken.
When price stays below the Zero Lag Moving Average, the trend is bearish and only sell signals are considered.
This strategy works well on M15 and H1 charts for both intraday and swing trading.
It helps traders avoid counter-trend trades and capture moves that travel further in the direction of momentum.
Signals are easy to spot and rules are straightforward, making the strategy suitable for all experience levels.
Buy Entry Rules
- Ensure price is above the Zero Lag Moving Average, indicating a buy trend.
- Wait for a blue arrow from the Bykov Trend Signals Indicator.
- Enter a buy trade when the blue arrow appears while price remains above the Zero Lag MA.
- Set stop loss below the recent swing low or below the moving average line.
- Set initial take profit at the next resistance level or use a 1:1.5 reward-to-risk ratio.
Sell Entry Rules
- Ensure price is below the Zero Lag Moving Average, indicating a sell trend.
- Wait for a magenta arrow from the Bykov Trend Signals Indicator.
- Enter a sell trade when the magenta arrow appears while price remains below the Zero Lag MA.
- Set stop loss above the recent swing high or above the moving average line.
- Set initial take profit at the next support level or use a 1:1.5 reward-to-risk ratio.
Advantages
- Trend confirmation from the Zero Lag Moving Average helps reduce false entries.
- Clear entry arrows make trade decisions simple and quick.
- Easy to apply on multiple time frames, especially M15 and H1.
- Works well with major currency pairs that show strong trends.
- Combines trend filtering with precise entry timing.
- Suitable for both intraday and swing trading styles.
- Helps focus trades in the direction of dominant momentum.
- Visual signals reduce guesswork and emotional trading decisions.
Drawbacks
- The strategy can give late entries during fast market moves.
- Sideways or range-bound markets may produce multiple false arrows.
- Requires patience to wait for trend confirmation before entering trades.
- May need wider stops during high volatility sessions.
- Profit targets may need adjusting according to pair volatility.
Case Study 1
On EURUSD H1, price was above the Zero Lag Moving Average, indicating a strong uptrend.
A blue arrow from the Bykov Trend Signals Indicator appeared at 1.0920.
A buy trade was opened with a stop loss at 1.0895 below the swing low.
Price continued upward to 1.0970 before pulling back, resulting in a 50-pip gain.
Trend alignment and a clear signal helped capture a strong rally during the London session.
Case Study 2
On USDJPY M15, price was below the Zero Lag Moving Average, signaling a downtrend.
A magenta arrow appeared at 149.35.
A sell trade was entered with a stop loss above the recent swing high at 149.65.
Price continued downward to 148.90, capturing 45 pips before finding support.
Using the moving average to confirm the trend prevented a counter-trend entry.
Strategy Tips
- Use the moving average as dynamic support or resistance when adjusting stop loss or take profit.
- Consider moving the stop loss to break even once the trade moves in your favor by half the take profit distance.
- Keep a trade journal to review performance and refine entry timing over time.
- Backtest the strategy on multiple pairs to understand how different volatility affects outcomes.
- Focus on major pairs like EURUSD, GBPUSD, and USDJPY for more predictable trend behavior.
- Adjust take profit levels based on recent price action rather than fixed pip targets only.
Download Now
Download the “bykovtrend-sig.mq4” Metatrader 4 indicator
FAQ
What is the SSP setting and how does it affect signals?
The SSP setting controls signal sensitivity.
Lower values produce faster signals, higher values produce slower but more reliable signals. Adjust according to trading style.
Can I use this indicator as a stand-alone system?
Yes, set SSP to 50 or above for more reliable stand-alone signals.
For faster entries, combine with trend analysis or moving averages.
How should I exit trades?
Close trades when an opposite arrow appears, or use your own exit method based on support/resistance or price action.
Summary
The Bykov Trend Signals indicator for MT4 makes trend-following simple with clear aqua buy and magenta sell arrows.
Adjustable SSP settings allow traders to balance speed and reliability.
Signals are easy to read, and trades can be exited either on opposite arrows or personal exit strategies.
Combined with trend analysis, this indicator helps traders follow the market with confidence and precision.


