
About the CCI Signals Indicator
The CCI Signals indicator for MT4 is a specialized version of the Commodity Channel Index (CCI) that generates buy and sell arrows directly on the chart.
Green arrows signal a buy when CCI reaches the -100 oversold level, while red arrows signal a sell when CCI reaches the 100 overbought level.
This indicator is ideal for range-bound markets but can give false signals in strong trending markets.
To improve accuracy, combine it with a trend-following indicator such as a 100-period SMA or a 75-period EMA.
Trade only in the direction of the underlying trend: above the trend line focus on green arrows, below the trend line focus on red arrows.
All default settings can be customized through the indicator’s input tab.
Free Download
Download the “cci-signals.mq4” MT4 indicator
Key Features
- Displays buy (green) and sell (red) arrows on the chart for quick signals.
- Uses oversold (-100) and overbought (100) levels for entry points.
- Best used in range-bound markets.
- Works with trend-following indicators for safer trades.
- Fully adjustable settings for different trading styles and timeframes.
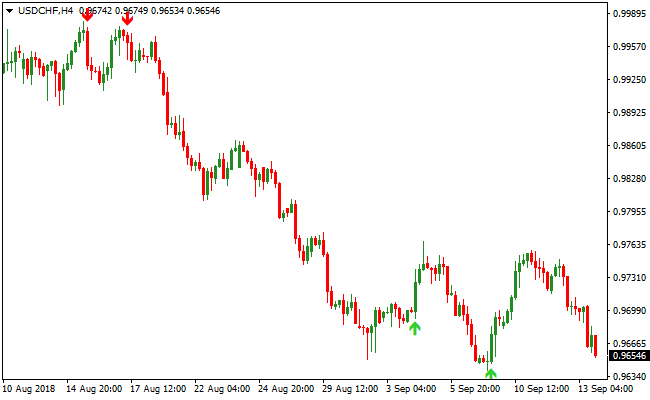
Indicator Chart
The chart shows the CCI Signals indicator in action.
Green arrows appear at extreme oversold levels, and red arrows appear at extreme overbought levels.
Combined with a trend-following line, traders can filter signals and take trades in the direction of the main trend, reducing the risk of false entries.
Guide to Trade with CCI Signals
Buy Rules
- Wait for a green arrow to appear at the -100 oversold level.
- Confirm price is above a trend-following indicator like the 100 SMA or 75 EMA.
- Enter a buy trade when the next candle opens after the arrow appears.
- Avoid buying if price is below the trend line or a red arrow appears.
Sell Rules
- Wait for a red arrow to appear at the 100 overbought level.
- Confirm price is below a trend-following indicator like the 100 SMA or 75 EMA.
- Enter a sell trade when the next candle opens after the arrow appears.
- Avoid selling if price is above the trend line or a green arrow appears.
Stop Loss
- For Buy trades, place the stop loss just below the recent swing low near the green arrow.
- For Sell trades, place the stop loss just above the recent swing high near the red arrow.
Take Profit
- For Buy trades, close when a red arrow appears or price reaches nearby resistance.
- For Sell trades, close when a green arrow appears or price reaches nearby support.
CCI Signals Indicator and Zero Lag MACD Forex Scalping Strategy for MT4
This MT4 scalping strategy uses the CCI Signals Indicator to indicate buy and sell entry points with green and red arrows.
The Zero Lag MACD Indicator shows trend direction, where readings above zero indicate a bullish trend and readings below zero indicate a bearish trend.
The strategy is designed for M1, M5, and M15 charts and focuses on capturing short-term price movements in the direction of the main trend.
By using the signal arrows alongside the MACD trend filter, traders can enter high-probability scalping trades while minimizing false signals.
Buy Entry Rules
- Confirm that the Zero Lag MACD is above zero, indicating an uptrend.
- Wait for a green arrow from the CCI Signals Indicator.
- Enter a buy trade when the green arrow appears while the MACD remains above zero.
- Set stop loss below the most recent swing low or a nearby support level.
- Take profit after 10–25 pips or at the next resistance level depending on volatility.
Sell Entry Rules
- Confirm that the Zero Lag MACD is below zero, indicating a downtrend.
- Wait for a red arrow from the CCI Signals Indicator.
- Enter a sell trade when the red arrow appears while the MACD remains below zero.
- Set stop loss above the most recent swing high or a nearby resistance level.
- Take profit after 10–25 pips or at the next support level depending on price movement.
Advantages
- Fast and precise entry signals are ideal for scalping.
- Trend confirmation reduces the likelihood of false entries.
- Works on multiple short-term time frames including M1, M5, and M15.
- Visual signals make trades easier to follow and act quickly upon.
- Effective on major and liquid currency pairs for reliable moves.
- Helps capture small, repeatable profits throughout the trading session.
- Reduces emotional trading by providing clear rules and confirmations.
- Can identify both trend continuation and reversal opportunities for quick trades.
Drawbacks
- Fast-moving markets can cause late entries on smaller time frames.
- Sideways or choppy conditions may produce false signals.
- Constant monitoring is required on low time frames to manage trades effectively.
Case Study 1
On USDCHF M5, the Zero Lag MACD stayed above zero, signaling an uptrend.
A green arrow from the CCI Signals Indicator appeared at 0.9152.
A buy trade was opened with a stop loss at 0.9145 below the recent swing low.
Price moved quickly to 0.9167, capturing 15 pips in about 25 minutes.
The trade succeeded because the signal arrow and MACD trend aligned perfectly during the London session.
Case Study 2
On NZDUSD M1, the Zero Lag MACD dropped below zero, signaling a downtrend.
A red arrow from the CCI Signals Indicator appeared at 0.6678.
A sell trade was opened with a stop loss at 0.6685 above the recent swing high.
Price moved down to 0.6660, gaining 18 pips in under 10 minutes.
The combination of MACD trend and CCI arrow confirmation allowed a quick and high-probability scalp.
Strategy Tips
- Only enter trades when both the signal arrow and MACD trend confirm the direction.
- Keep stop losses tight to protect capital during rapid reversals.
- Avoid scalping during high-impact news releases to reduce the risk of sudden losses.
- Take profits quickly, as this is a fast scalping strategy and small moves are targeted.
- Adjust trade size according to time frame volatility and personal risk tolerance.
Download Now
Download the “cci-signals.mq4” Metatrader 4 indicator
FAQ
Is the CCI Signals Indicator good for trending markets?
No, it works best in range-bound markets.
In trending markets, signals may be false, so use a trend-following indicator to filter entries.
Can I adjust the oversold and overbought levels?
Yes, the default -100 and 100 levels can be modified in the indicator input settings to suit different currency pairs or timeframes.
Which trend indicators work best with CCI Signals?
The 100-period SMA or 75-period EMA are recommended.
Trade green arrows only when price is above the trend line and red arrows only when price is below it.
Is this indicator suitable for all timeframes?
Yes, it works on M5, M15, H1, and higher.
Shorter timeframes are best for intraday trading, while longer timeframes can be used for swing trades.
Summary
The CCI Signals indicator for MT4 makes trading easier by showing buy and sell arrows at extreme oversold and overbought levels.
Its effectiveness improves when combined with a trend-following indicator to avoid counter-trend trades.
Traders can adjust the input settings to fit their preferred currency pairs and timeframes.
By focusing only on arrows in the direction of the main trend, this indicator helps improve entry timing, reduce false signals, and increase trading confidence in range-bound markets.


