
About the Consecutive Candlesticks With Stochastic Indicator
The Consecutive Candlesticks With Stochastic Indicator is a momentum-based technical tool for Metatrader 4 that specializes in identifying price exhaustion and trend acceleration.
The primary benefit of the Consecutive Candlesticks With Stochastic Indicator is its ability to pinpoint high-probability entries during volatile market phases.
While the dots provide the signal, the Stochastic filter tracks the overbought and oversold extremes between the 0 and 100 levels.
By identifying when consecutive price action aligns with momentum extremes, the tool offers a precise execution trigger.
It is particularly effective for scalpers and day traders who need to react quickly to short-term bursts of price activity.
Free Download
Download the “consecutive-candles-with-stochastic-filter-indicator.mq4” MT4 indicator
Key Features
- The indicator tracks successive candle closes to identify market momentum.
- A built-in Stochastic filter identifies overbought and oversold conditions.
- The separate window layout keeps the main price chart free from clutter.
- The system is optimized for high-frequency trading on lower timeframes.
Indicator Chart
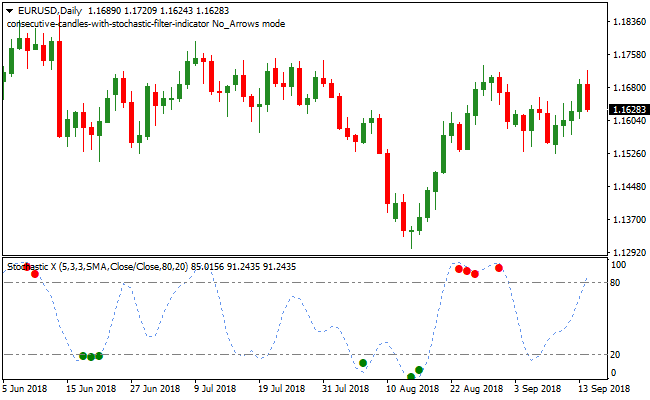
The chart displays the Consecutive Candlesticks With Stochastic Indicator in the sub-window, where you can see the Stochastic line and the colored signal dots.
Green dots appearing at lower Stochastic levels suggest that a bullish reversal or continuation is likely.
Conversely, red dots at higher levels indicate that the market may be ready to turn lower.
Guide to Trade with Consecutive Candlesticks With Stochastic Indicator
Buy Rules
- Confirm the primary market trend is bullish using a moving average.
- Wait for the Stochastic filter to reach oversold territory near the 0 level.
- Enter a long position when a green dot appears in the indicator window.
- Ensure the green dot aligns with a recent bounce off a support zone.
Sell Rules
- Confirm the primary market trend is bearish using a moving average.
- Wait for the Stochastic filter to reach overbought territory near the 100 level.
- Initiate a short trade when a red dot appears in the indicator window.
- Ensure the red dot aligns with a recent rejection from a resistance level.
Stop Loss
- Place your stop loss a few pips below the most recent swing low for buy trades.
- Position the stop loss a few pips above the most recent swing high for sell trades.
- Set a dynamic stop loss at the level of the indicator signal line to exit if the trend shifts.
- Use a fixed volatility stop based on the average daily range to avoid being cleared by market noise.
Take Profit
- Close the open position as soon as a dot of the opposite color appears in the indicator window.
- Exit the trade when the price reaches a major psychological level or a previous daily pivot.
- Set a target at the nearest major support or resistance zone identified on the higher timeframe.
- Harvest profits when the Stochastic filter reaches the opposite extreme level of 0 or 100.
Consecutive Candlesticks with Stochastic + 4 Time Frame Hull Trend Forex Scalping Strategy
This scalping strategy combines the Consecutive Candlesticks with Stochastic MT4 Indicator and the 4 Time Frame Hull Trend Indicator for MT4 to help you find quick and high-probability trades on the M1 and M5 charts.
The first indicator displays colored dots showing short‑term momentum signals: trade green dots when the trend is up and red dots when the trend is down.
The second indicator shows trend bias across four time frames using Hull Moving Averages (HMAs): a buy bias is confirmed when all four HMAs are green and a sell bias when all four are purple.
This system is designed for fast markets and quick decision making.
By combining short‑term entry dots with multi‑time frame trend confirmation, you reduce noise and avoid entering counter‑trend moves.
The strategy is ideal for scalpers who want clear entry and exit rules and prefer to trade within a clearly defined trend context.
Buy Entry Rules
- All four HMAs of the 4 Time Frame Hull Trend indicator are green, confirming bullish bias.
- A green dot appears from the Consecutive Candlesticks with the Stochastic indicator.
- Enter a buy trade at the close of the candle that produced the green dot.
- Place a stop loss a few pips below the recent minor swing low or below the low of the entry candle.
- Take profit at a small target between 6 and 15 pips on M1, and between 10 and 20 pips on M5 charts.
Sell Entry Rules
- All four HMAs of the 4 Time Frame Hull Trend indicator are purple, confirming bearish bias.
- A red dot appears from the Consecutive Candlesticks with the Stochastic indicator.
- Enter a sell trade at the close of the candle that produced the red dot.
- Place a stop loss a few pips above the recent minor swing high or above the high of the entry candle.
- Take profit at 6 to 15 pips on M1 or 10 to 20 pips on M5 before any reversal signal appears.
Advantages
- Combining short-term momentum with multi-timeframe trend confirmation improves trade accuracy.
- Visual dots and color-coded HMAs make signals easy to interpret quickly, ideal for scalping.
- Frequent trading opportunities on M1 and M5 charts during active sessions.
- Helps traders stay aligned with the dominant trend, reducing counter-trend losses.
- Clear entry and exit criteria make the strategy systematic and repeatable.
- Works well on major currency pairs with strong intraday movements.
Drawbacks
- Small pip targets require multiple successful trades to build significant profits.
- Fast market moves may trigger tight stop losses before the trade develops.
- Requires constant attention and active monitoring due to the short timeframes.
- Trend alignment may lag slightly on M1 charts, leading to late entries.
Example Case Study 1
On USDJPY M1 during the London session, all four HMAs on the 4 Time Frame Hull Trend indicator turned green, confirming a bullish bias.
After a small pullback, the Consecutive Candlesticks with Stochastic indicator printed a green dot at 148.30.
A buy trade was entered at 148.31 with a stop loss at 148.26.
Price moved quickly upward and hit the 10 pip target at 148.41 within 8 minutes.
The trade was closed with +10 pips before the next red dot appeared.
Example Case Study 2
On EURUSD M5 during the New York session, all four HMAs turned purple on the 4 Time Frame Hull Trend indicator, confirming bearish bias.
After a short retracement, a red dot appeared at 1.0982 on the Consecutive Candlesticks with Stochastic indicator.
A sell order was placed at 1.0981 with a stop loss at 1.0990.
Price dropped steadily over the next 15 minutes and reached the 15 pip take profit at 1.0966.
The trade was closed with +15 pips before the trend began to shift.
Strategy Tips
- Wait for both indicators to confirm the trend before entering a trade to increase the probability of success.
- Trade only during active sessions to capture faster moves and avoid flat market conditions.
- Use micro‑timeframe charts (M1) for quick scalps and M5 for slightly larger targets while maintaining fast entries.
- Combine with simple support and resistance levels to filter entries near key price zones.
- Keep a trade journal to review which currency pairs and times produce the best results for this strategy.
- Adjust the take profit dynamically based on recent price volatility to capture optimal pip gains.
Download Now
Download the “consecutive-candles-with-stochastic-filter-indicator.mq4” Metatrader 4 indicator
FAQ
Is this indicator better for scalping or swing trading?
This indicator is primarily designed for scalping and intraday trading on M5 and M15 timeframes.
It excels at capturing the immediate momentum that follows a sequence of identical candle closes in volatile sessions.
Can I adjust the number of consecutive candles required?
Yes, the indicator settings allow you to modify the sensitivity.
You can change the candle count and the Stochastic parameters in the inputs tab to better match the volatility of your favorite currency pairs.
Summary
The Consecutive Candlesticks With Stochastic Indicator is a unique tool that combines price action geometry with classic momentum analysis.
Its primary benefit is the clear, dot-based signaling system that identifies when the market is gaining significant directional speed.
While it is easy to follow, the best results are achieved when trading in the direction of the underlying trend.
By focusing on signals at Stochastic extremes, traders can effectively filter out minor fluctuations.


