About the LRMA Bollinger Bands Indicator
The LRMA Bollinger Bands indicator for MT4 blends traditional Bollinger Bands with the LRMA trading indicator to create a smoother and more trend-aware channel.
While it follows the same logic as standard Bollinger Bands, the LRMA center line improves trend recognition and pullback timing.
The indicator expands and contracts with volatility while also showing the direction of the dominant trend.
When the bands slope upward, market pressure favors buyers. When the bands slope downward, sellers control momentum.
Instead of trading breakouts, this indicator focuses on pullback opportunities within an active trend.
Traders look for price reactions near the LRMA center line or near the outer Bollinger Band levels.
Its adaptable design makes it suitable for scalping, intraday trading, and swing trading across different market conditions.
Free Download
Download the “lrma-bb-indicator.mq4” MT4 indicator
Key Features
- Combines Bollinger Bands with the LRMA trend line.
- Identifies bullish and bearish trends through band direction.
- Highlights pullback zones within trending markets.
- Works across all timeframes and trading styles.
- Supports price action confirmation techniques.
- Offers smoother trend behavior than standard BB setups.
Indicator Chart
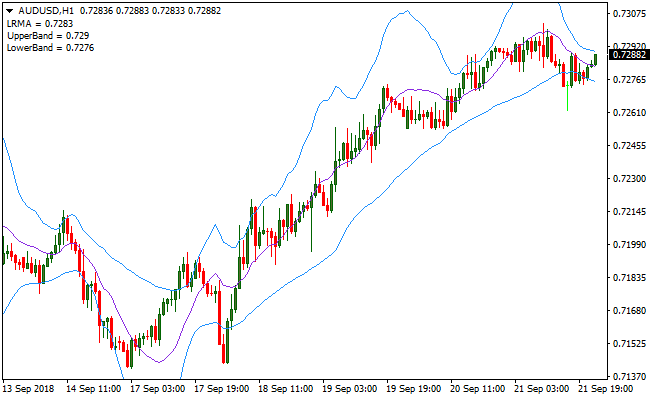
The chart displays the LRMA Bollinger Bands indicator applied to a trending market.
The purple LRMA center line guides trend direction, while the blue Bollinger Bands outline dynamic support and resistance.
Buy and sell opportunities appear as price pulls back toward key areas during active trends.

Guide to Trade with the LRMA Bollinger Bands Indicator
Buy Rules
- Confirm the Bollinger Bands are sloping upward.
- Wait for price to pull back toward the LRMA center line.
- Watch for price interaction near the lower band or center line.
- Enter a buy trade after a bullish candlestick reversal forms.
Sell Rules
- Confirm the Bollinger Bands are sloping downward.
- Allow price to retrace toward the LRMA center line.
- Observe rejection near the upper band or center line.
- Enter a sell trade after a bearish candlestick reversal appears.
Stop Loss
- Place the stop loss beyond the recent pullback extreme.
- Use the opposite Bollinger Band as a protective buffer.
- Apply a volatility-based stop during fast markets.
- Exit the trade if band direction starts flattening.
Take Profit
- For buy trades, target the upper Bollinger Band.
- For sell trades, target the lower Bollinger Band.
- Close the trade if price stalls near key levels.
- Trail profits while the bands maintain direction.
LRMA Bollinger Bands + 4 Moving Averages Forex Scalping Strategy
This scalping strategy combines the LRMA Bollinger Bands MT4 Indicator and the 4 Moving Averages Buy/Sell Signals MT4 Indicator to capture short-term trend moves in the market.
The LRMA Bollinger Bands show the overall trend direction based on the slope of the bands. Rising bands indicate bullish momentum, while falling bands indicate bearish momentum.
The 4 Moving Averages indicator provides fast entry signals with colored bars.
Green bars above zero signal bullish conditions, and purple bars below zero signal bearish conditions.
Combining these two indicators allows scalpers to enter trades aligned with the trend and exit quickly for small but frequent profits.
This strategy works best on lower time frames such as M1, M5, and M15.
It is designed for active traders who prefer quick trades with tight stops.
The dual confirmation reduces false signals and helps identify short-term trends in high-probability zones.
Scalpers can trade multiple currency pairs, focusing on those with good liquidity during major trading sessions.
Buy Entry Rules
- LRMA Bollinger Bands are rising, indicating a bullish trend.
- 4 Moving Averages indicator shows green bars above the zero level.
- Enter a buy trade at the open of the next candle after both conditions are met.
- Place a stop loss below the most recent swing low or below the lower Bollinger Band.
- Set take profit around 1–1.5 times the stop-loss distance or trail using the lower Bollinger Band for dynamic exit.
Sell Entry Rules
- LRMA Bollinger Bands are falling, indicating a bearish trend.
- 4 Moving Averages indicator shows purple bars below the zero level.
- Enter a sell trade at the open of the next candle after both conditions are met.
- Place a stop loss above the most recent swing high or above the upper Bollinger Band.
- Set take profit around 1–1.5 times the stop-loss distance or trail using the upper Bollinger Band for dynamic exit.
Advantages
- Helps capture short-term trends with quick entry and exit signals.
- Combining trend direction and bar confirmation reduces false scalping signals.
- Works on multiple timeframes, making it versatile for M1, M5, and M15 charts.
- Indicators are visual and easy to interpret, suitable even for beginners.
- Dynamic exit options allow traders to adapt to fast-moving markets.
- Scalable to different currency pairs, especially high-liquidity ones.
- Enables precise timing for scalp trades without relying on complex indicators.
- Can be combined with support and resistance zones for higher accuracy entries.
Drawbacks
- Rapid price spikes may trigger stops prematurely, especially on low liquidity pairs.
- Requires constant monitoring and fast reaction due to small profit targets.
- May underperform during news events unless you avoid trading during major releases.
- Not ideal for traders who prefer longer-term positions or automated strategies without supervision.
- Profit potential per trade is limited, so risk-reward management is essential.
Example Case Study 1
On EURUSD M5, the LRMA Bollinger Bands were rising and the 4 Moving Averages indicator displayed green bars above zero.
A buy trade was entered at 1.1025 with a stop loss at 1.1015 and a take profit at 1.1047.
The trade moved in favor over the next 15 minutes, achieving a 22-pip gain.
The combination of the rising bands and green bar confirmation ensured entry during a short-term bullish spike.
Example Case Study 2
On GBPUSD M1, the LRMA Bollinger Bands were falling and the 4 Moving Averages indicator displayed purple bars below zero.
A sell trade was entered at 1.2480 with a stop loss at 1.2488 and take profit at 1.2465.
Within 10 minutes, the price moved down and hit the take profit for a 15-pip gain.
Scalping with both indicators allowed the trader to capture a quick trend move while avoiding minor counter-trend bounces.
Strategy Tips
- Rising LRMA Bollinger Bands indicate bullish momentum; falling bands indicate bearish momentum.
- Confirm trend direction with the 4 Moving Averages indicator before entering.
- Focus on highly liquid pairs such as EURUSD, GBPUSD, and USDJPY during major sessions.
- Keep risk per trade low, around 1% of your account, since scalping involves frequent trades.
- Combine with session timing to avoid choppy conditions during low-volume periods.
- Use trailing stops along the Bollinger Bands to lock in profits when trends continue.
- Avoid trading during major economic news releases unless prepared for higher volatility.
- Backtest the strategy on each pair to understand typical pip ranges and best time frames.
Download Now
Download the “lrma-bb-indicator.mq4” Metatrader 4 indicator
FAQ
How is this indicator different from standard Bollinger Bands?
The LRMA center line improves trend filtering and reduces noise compared to a simple moving average.
Does this indicator work better in trending markets?
Yes, it is designed to capture pullbacks within established trends rather than sideways conditions.
Which confirmation tools pair well with this indicator?
Candlestick reversal patterns and momentum indicators work well for timing entries.
Can beginners use the LRMA Bollinger Bands indicator?
Yes, its visual layout makes trend direction and pullback zones easy to identify.
Summary
The LRMA Bollinger Bands indicator offers a refined approach to trading trends using volatility and direction together.
By focusing on pullbacks rather than breakouts, it supports more controlled entries aligned with momentum.
Its flexibility across timeframes and trading styles makes it a practical addition to many MT4 trading strategies.


