
About the Wedges Pattern indicator
The Wedges Pattern indicator for MT4 identifies potential trend reversals using classic wedge trading patterns.
It scans any currency pair to detect rising and falling wedges and signals when price breaks out of the pattern.
Traders can use these breakouts to enter bullish or bearish positions.
The indicator simplifies spotting reversals, reducing the need for manual chart analysis.
It works for scalping, day trading, and swing trading on multiple timeframes.
Free Download
Download the “wedges-indicator.mq4” MT4 indicator
Key Features
- Automatically detects rising and falling wedge patterns.
- Signals potential bullish breakouts above the upper wedge trendline.
- Signals potential bearish breakouts below the lower wedge trendline.
Indicator Chart
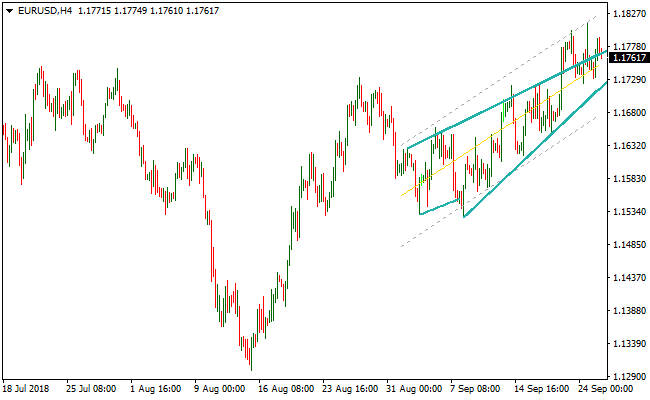
The image below shows the Wedges Pattern indicator applied to an MT4 chart.
It highlights rising and falling wedge formations and indicates breakout directions for potential buy or sell trades.
Guide to Trade with Wedges Pattern indicator
Buy Rules
- Open a buy trade when price closes above the upper wedge trendline.
- Confirm the overall trend is bullish using a trend-following indicator.
- Check that the breakout occurs on increasing volume for reliability.
Sell Rules
- Open a sell trade when price closes below the lower wedge trendline.
- Confirm the overall trend is bearish using a trend-following indicator.
- Check that the breakout is supported by market momentum.
Stop Loss
- For buy trades, place the stop loss just below the breakout wedge low.
- For sell trades, place the stop loss just above the breakout wedge high.
Take Profit
- Close trades when price reverses back inside the wedge pattern.
- Optionally, set a risk-to-reward ratio that matches your strategy.
- Adjust take profit dynamically if the breakout is strong or trending.
Wedges Pattern and Simple Linear Regression MT4 Strategy
This strategy combines the Wedges Pattern MT4 Indicator with the Simple Linear Regression MT4 Indicator to provide traders with precise entry and exit points.
By combining these two indicators, you can identify both the timing of breakout moves and the overall market trend, which helps in reducing false signals and improving trading accuracy.
The Wedges Pattern indicator identifies narrowing price formations that typically precede strong breakout movements.
When combined with the Simple Linear Regression indicator, which provides a visual channel showing trend direction and slope, traders can filter trades based on high-probability setups.
This combination works effectively on multiple time frames, including M15, H1, and H4, allowing both day traders and swing traders to find opportunities in different market conditions.
It eliminates the guesswork by clearly defining entry points, stop loss levels, and take profit targets.
Beginners will appreciate the simplicity and clarity, while experienced traders can use it to enhance their existing strategies by adding a precise breakout confirmation layer.
Buy Entry Rules
- Identify a bullish wedge formation. The price should be consolidating in a narrowing range with an upward breakout potential.
- Confirm that the price is above the middle line of an upward sloping regression channel.
- Enter a buy trade when price breaks above the upper wedge trendline.
- Place a stop loss slightly below the lower wedge trendline or the last swing low.
- Set a take profit at a level at least twice the stop loss distance or at the next resistance zone.
Sell Entry Rules
- Identify a bearish wedge formation. The price should be consolidating in a narrowing range with a downward breakout potential.
- Confirm that the price is below the middle line of a downward sloping regression channel.
- Enter a sell trade when price breaks below the lower wedge trendline.
- Place a stop loss slightly above the upper wedge trendline or the last swing high.
- Set a take profit at a level at least twice the stop loss distance or at the next support zone.
Advantages
- Works on multiple time frames for flexible trading.
- Combines breakout signals with trend confirmation for higher accuracy.
- Suitable for both beginners and experienced traders.
- Captures both short-term and medium-term market movements effectively.
Drawbacks
- Requires monitoring wedge formations and the regression channel slope constantly.
- Stop loss may be tight in volatile conditions, resulting in occasional small losses.
Case Study 1: Bullish Breakout (AUD/USD M15)
During the Asian trading session, a bullish wedge pattern developed on the AUD/USD 15-minute chart.
Confirmation of bullish momentum was established when the price sustained movement above the upward-sloping regression channel.
A long position was initiated at 0.6742 when the price broke above the upper wedge trendline.
The stop loss was set at 0.6730 and the take profit was set at 0.6760.
The trade was successful, yielding an 18-pip profit.
Case Study 2: Bearish Breakout (USD/JPY H1)
In the New York session, a bearish wedge pattern was identified on the USD/JPY 1-hour chart.
The bearish bias was validated by the price trading consistently below the downward-sloping regression channel.
A short position was entered at 148.35 when the price broke below the lower wedge trendline.
The stop loss was set at 148.52 and the take profit was set at 148.13.
The trade concluded profitably with a 22-pip gain, highlighting the strategy’s effectiveness in capturing decisive bearish breakout moves.
Strategy Tips
- Always wait for the wedge breakout candle to close before entering a trade to reduce the chance of false signals.
- Check the slope of the regression channel first. Entering trades against the slope increases the risk of losses.
- Use multiple time frame analysis. Confirm the trend on H1 or H4 before taking trades on M15 for better alignment.
- Combine this strategy with support and resistance zones to improve take profit accuracy and avoid early exits.
- Consider partial profit-taking for longer trends while moving the stop loss to break-even to protect gains.
- Keep a trading journal to track wedge breakout success rates and regression channel alignment over time.
- Focus on pairs that have clear trending behavior and avoid pairs that tend to move sideways frequently.
- Use proper risk management. Never risk more than 1-2% of your account on a single trade, even with high probability setups.
Download Now
Download the “wedges-indicator.mq4” Metatrader 4 indicator
FAQ
How does the indicator detect wedges?
The indicator scans for consecutive higher lows and lower highs (rising wedge) or lower highs and higher lows (falling wedge) to identify potential reversal patterns.
Can this indicator be used on all timeframes?
Yes, it works on short-term charts like M1, M5, as well as longer timeframes like H1, H4, and D1.
Should I combine it with other indicators?
It is recommended to use trend-following indicators such as moving averages or ADX to confirm breakout direction and improve trade reliability.
Summary
The Wedges Pattern indicator helps traders spot potential trend reversals using rising and falling wedge formations.
It simplifies breakout trading by providing clear signals for both bullish and bearish moves.
Combining it with trend indicators can enhance trade accuracy and risk management.


