About the Multi Signals Dashboard Indicator
The Multi Signals Dashboard indicator for MT4 is designed to give Forex traders a fast overview of market conditions without switching between multiple charts or indicators.
Instead of analyzing each technical tool separately, this dashboard summarizes trend signals from several well-known indicators in one compact display on the main chart.
The indicator scans MACD, PSAR, Moving Averages, RSI, and ADX, then converts their readings into simple bullish or bearish symbols.
A blue symbol represents bullish conditions, while a red symbol signals bearish conditions.
One of its strongest benefits is the combined “ALL” signal.
This value aggregates the individual indicator readings and shows the overall market bias at a glance.
When all or most components align, the dashboard highlights stronger directional conditions.
The indicator supports multiple timeframes, making it useful for scalping, intraday trading, and higher-timeframe analysis.
Free Download
Download the “1-min-micro-trading.mq4” MT4 indicator
Key Features
- Combines multiple technical indicators into one dashboard.
- Displays bullish and bearish conditions using simple color signals.
- Includes an aggregated “ALL” trend signal.
- Supports M1, M5, M30, H1, H4, and D1 timeframes.
- Helps reduce chart clutter and analysis time.
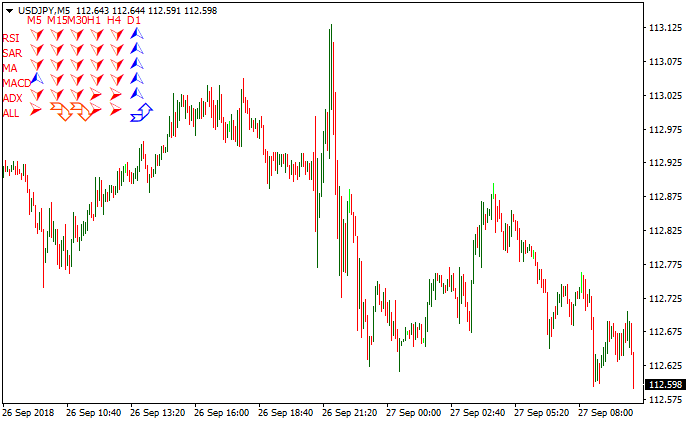
Indicator Chart
Below is an MT4 chart illustrating how the Multi Signals Dashboard indicator appears in live market conditions.
The dashboard displays individual trend readings for each technical indicator, along with the overall “ALL” signal that reflects combined market direction.

Guide to Trade with the Multi Signals Dashboard Indicator
Buy Rules
- Wait for the “ALL” outcome symbol to turn blue.
- Confirm that most individual indicators show bullish symbols.
- Check that price action supports upward movement.
- Enter a buy trade at the close of the signal candle.
Sell Rules
- Wait for the “ALL” outcome symbol to turn red.
- Confirm that most individual indicators show bearish symbols.
- Ensure price action aligns with downside pressure.
- Enter a sell trade at the close of the signal candle.
Stop Loss
- Place the stop loss beyond the most recent consolidation area.
- Keep it outside short-term market noise.
- Adjust distance based on the active timeframe.
Take Profit
- Close trades when the “ALL” signal changes color.
- Secure partial profits near recent support or resistance.
- Alternatively, use a predefined risk-to-reward ratio.
- Trail profits if trend alignment remains strong.
Multi Signals Dashboard + Double Moving Average Signal MT4 Trend Strategy
This MT4 strategy helps traders follow the main market trend while confirming momentum for precise entries. The Multi Signals Dashboard provides a clear overview of trend direction.
When the “ALL” symbol turns blue, the market is bullish. When it turns red, the market is bearish.
The Double Moving Average Signal adds confirmation through its histogram: above zero indicates a buy trend, and below zero indicates a sell trend.
Combining both indicators helps filter out weak signals and focus on trades aligned with the overall market momentum, making it suitable for M1, M5, and M15 charts.
This strategy works best for traders who prefer clear and simple rules while maintaining flexibility for scalping or short-term trend trades.
It performs particularly well during active sessions such as London and New York, where market moves are stronger and more predictable.
Buy Entry Rules
- Dashboard “ALL” symbol must be blue, indicating a bullish trend.
- The Double Moving Average histogram must be above zero for momentum confirmation.
- Enter a buy trade at the open of the next candle after the histogram crosses above zero.
- Place a stop loss a few pips below the recent swing low or breakout point.
- Take profit: 15–30 pips on M5/M15, 8–15 pips on M1, or exit if the histogram falls below zero or the Dashboard “ALL” turns red.
Sell Entry Rules
- Dashboard “ALL” symbol must be red, indicating a bearish trend.
- The Double Moving Average histogram must be below zero for momentum confirmation.
- Enter a sell trade at the open of the next candle after the histogram crosses below zero.
- Stop loss a few pips above the recent swing high or breakout point.
- Take profit: 15–30 pips on M5/M15, 8–15 pips on M1, or exit if the histogram rises above zero or the Dashboard “ALL” turns blue.
Advantages
- Trend filter reduces counter-trend trades and improves accuracy.
- The histogram provides clear momentum confirmation for precise entries.
- Works across multiple timeframes for scalping and short-term trend trades.
- Simple rules make it easy to follow even during fast market movements.
- Targets and stop losses are easy to manage and balance risk/reward.
Drawbacks
- Waiting for both trend and momentum confirmation may miss the early parts of a move.
- Lower volatility periods may prevent targets from being hit before reversal.
- Requires quick reactions and attention on lower timeframes.
Example Case Study 1 (M5 Buy)
On EURUSD M5 during the London session, Dashboard “ALL” turned blue.
Shortly after, the Double Moving Average histogram crossed above zero.
A buy trade was opened at 1.09850. Stop loss was set at 1.09825 (10 pips risk).
Price moved to 1.10000 over 20 minutes.
The trade closed with +15 pips before the histogram flattened.
Example Case Study 2 (M1 Sell)
On GBPUSD M1, Dashboard “ALL” was red. The histogram dropped below zero, confirming momentum.
A sell trade was entered at 1.28210. Stop loss was set at 1.28235 (8 pips).
Price fell to 1.28150 in 5 minutes.
The trade closed for +6 pips before the histogram crossed back above zero.
Strategy Tips
- Only trade when the Dashboard “ALL” remains stable for several candles to avoid false signals.
- Focus on major pairs with tight spreads to maximize scalping profits.
- Avoid trading around major news events due to unpredictable volatility.
- Keep position sizes small on lower timeframes because of frequent signals and market noise.
- Skip trades if the histogram hovers near zero for extended periods; momentum is weak.
- Consider adding a volatility filter to trade only when sufficient market movement is present.
- Use a consistent stop and target strategy to maintain discipline over multiple trades.
Download Now
Download the “1-min-micro-trading.mq4” Metatrader 4 indicator
FAQ
What makes this dashboard different from single indicators?
Instead of focusing on one signal source, this indicator combines several popular tools to present a broader market view in one place.
Does the “ALL” signal require all indicators to agree?
The “ALL” signal reflects the combined outcome. Stronger signals occur when most indicators align in the same direction.
Can it be used for short-term trading?
Yes, the dashboard supports lower timeframes like M1 and M5, making it suitable for fast-paced trading styles.
Summary
The Multi Signals Dashboard MT4 indicator offers a practical way for traders to monitor multiple technical signals without overwhelming the chart.
By translating complex indicator data into simple bullish and bearish symbols, it speeds up decision-making and improves clarity.
Its multi-timeframe support and combined “ALL” signal make it especially useful for filtering trades and staying aligned with prevailing market conditions.


