
About the Complete Fibonacci Signals Indicator
The Complete Fibonacci Signals Indicator for MT4 is an all-in-one technical solution for traders who utilize the mathematical precision of the Fibonacci sequence.
Instead of manually plotting retracement and extension levels, this tool automates the process by identifying key price pivots and drawing the corresponding trading zones directly on the chart.
It focuses on identifying high-probability entry points where the market is likely to reverse or accelerate.
By providing clear, objective levels, the indicator removes the guesswork often associated with discretionary Fibonacci trading.
Free Download
Download the “bobokusfibo-indicator.mq4” MT4 indicator
Key Features
- Automatically calculates and plots Fibonacci-based entry and exit levels on the price chart.
- Provides clear labels for long and short trade triggers to ensure immediate execution.
- Includes three distinct profit target levels (T1, T2, and T3) for comprehensive trade management.
- Works efficiently across all timeframes, supporting various styles from scalping to swing trading.
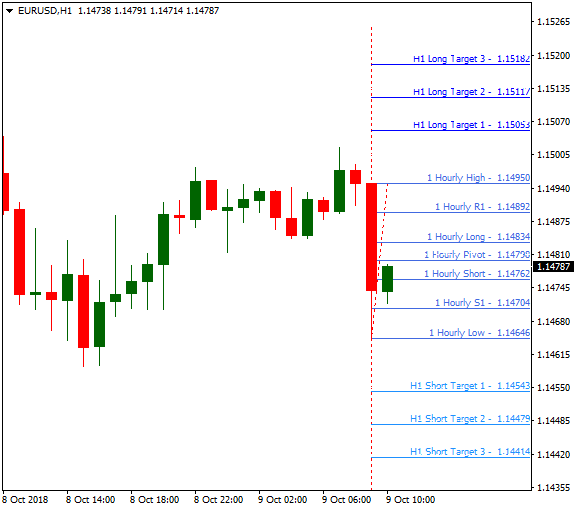
Indicator Chart
The Complete Fibonacci Signals Indicator displays a series of horizontal lines and text labels directly on the main activity chart.
It highlights the primary “Long” and “Short” breakout levels which serve as the entry triggers.
Additionally, the chart shows projected profit targets labeled as T1, T2, and T3.
Guide to Trade with Complete Fibonacci Signals Indicator
Buy Rules
- Monitor the price action as it approaches the “1 Hourly Long” level on the indicator.
- Wait for a bullish candle to break and close decisively above this specific long entry level.
- Ensure the broader market trend is upward to increase the probability of reaching the targets.
- Initiate a long trade at the start of the next candle once the breakout is confirmed.
Sell Rules
- Watch for the price to decline toward the “1 Hourly Short” level displayed on the chart.
- Execute a sell trade when the price breaks and closes below this designated short entry zone.
- Verify the bearish momentum with a secondary trend filter or price action analysis.
- Enter the short position immediately after the breakout candle has fully formed.
Stop Loss
- For buy trades, place the stop loss a few pips below the most recent swing low or the “Short” entry line.
- For sell trades, position the stop loss slightly above the most recent swing high or the “Long” entry line.
- Maintain a stop distance that protects your capital from temporary retracements while respecting market structure.
Take Profit
- Utilize the T1 level for a conservative exit or to move your stop loss to break even.
- Aim for T2 or T3 during strong trending markets to maximize the gain on the move.
- Alternatively, exit the position if the price reaches a major psychological level or a previous daily high/low.
Complete Fibonacci Signals + Zero Lag Moving Average Forex Day Trading Strategy
This strategy combines the Complete Fibonacci Signals MT4 indicator and the Zero Lag Moving Average to identify reliable intraday trading opportunities.
The Complete Fibonacci Signals indicator provides breakout levels based on Fibonacci retracements and extensions, while the Zero Lag MA acts as a trend filter to ensure trades are aligned with the market direction.
This combination helps traders capture strong moves while reducing false signals.
The strategy is most effective on intraday timeframes such as 15-minute, 30-minute, or 1-hour charts.
It is suitable for beginner and intermediate traders who prefer clear signals and structured rules.
It is most effective on pairs with consistent price action, where breakouts usually extend.
Buy Entry Rules
- Wait for the price to close above the “1 Hourly Long” level of the Complete Fibonacci Signals MT4 indicator, signaling a bullish breakout.
- Confirm that the price is above the Zero Lag MA line to ensure the trend is bullish.
- Enter a buy trade immediately after both conditions are confirmed.
- Place a stop loss below the breakout level or the most recent swing low to protect against reversals.
- Set take profit at the next resistance level, or follow the take profit level suggested by the Complete Fibonacci Signals indicator for a precise exit.
Sell Entry Rules
- Wait for the price to close below the “1 Hourly Short” level of the Complete Fibonacci Signals MT4 indicator, signaling a bearish breakout.
- Confirm that the price is below the Zero Lag MA line to ensure the trend is bearish.
- Enter a sell trade immediately after both conditions are confirmed.
- Place a stop loss above the breakout level or the most recent swing high to protect against reversals.
- Set take profit at the next support level, or follow the take profit suggested by the Complete Fibonacci Signals indicator for the exit.
Advantages
- Combines breakout signals with trend confirmation for higher probability trades.
- Clear entry rules, stop loss, and take profit make trading consistent and disciplined.
- Can be used on multiple intraday timeframes depending on the trader’s style.
- Helps traders identify both short-term and extended intraday moves.
Drawbacks
- Breakouts can fail, especially in low volatility or choppy markets.
- Trades are only taken when both indicators align, which can reduce the number of opportunities.
- Requires patience to wait for valid signals and proper trend confirmation.
- Profit levels vary depending on the pair’s volatility and intraday price action.
Case Study 1
EUR/JPY, 30-minute chart: The price closed above the “1 Hourly Long” level and was above the Zero Lag MA.
A buy trade was opened, stop loss placed 15 pips below the breakout level.
Price advanced to the next resistance level, achieving 38 pips.
The trend continued slightly further, demonstrating how following the trend improves the trade’s success.
Case Study 2
USD/CAD, 1-hour chart: The price closed below the “1 Hourly Short” level and was below the Zero Lag MA.
A sell trade was opened, stop loss set 20 pips above the breakout level.
Price dropped steadily, reaching the next support level for a profit of 47 pips.
Case Study 3
AUD/USD, 30-minute chart: Price broke above the “1 Hourly Long” level with a strong bullish candle.
Zero Lag MA confirmed the upward trend.
Stop loss placed below the recent swing low, take profit followed the indicator’s suggested level.
The trade captured 42 pips as the bullish momentum continued into the next hour.
Strategy Tips
- Focus on pairs with moderate volatility to reduce false breakouts.
- Avoid trading around major news events as they can cause sudden spikes or whipsaws.
- Always use proper position sizing to protect your account against unexpected moves.
- Consider trailing your stop after the price moves in your favor to secure profits while allowing for extended trends.
- Backtest this strategy on different pairs to identify which combinations of breakout levels and trend confirmation work best.
- Keep a trading journal to review performance and fine-tune stop loss and take profit levels according to pair behavior.
Download Now
Download the “bobokusfibo-indicator.mq4” Metatrader 4 indicator
FAQ
How are the T1, T2, and T3 targets calculated?
The profit targets in the Complete Fibonacci Signals Indicator are based on Fibonacci extension levels.
These levels represent the most common areas where a trending move is likely to stall or reverse.
T1 is usually a high-probability conservative target, while T3 represents an extended move based on higher market volatility.
Does the indicator reset its levels throughout the day?
The Complete Fibonacci Signals Indicator updates its levels based on the most recent price action and volatility peaks.
This ensures that the entry and exit zones you see are always relevant to the current market environment.
It is important to look at the levels provided for the specific timeframe you are trading.
Summary
The Complete Fibonacci Signals Indicator offers a professional and automated way to implement one of the most successful mathematical concepts in trading.
By identifying specific entry and exit zones, it provides the discipline needed to trade the markets objectively.
To achieve the best results, use these signals in conjunction with a solid understanding of market trend and session volatility.
Trading in the direction of the higher timeframe trend while using these Fibonacci levels as triggers can significantly enhance your performance.


