
About the Bollinger Bands Squeeze with MACD Indicator
The Bollinger Bands Squeeze with MACD Indicator for MT4 is a sophisticated technical tool designed to identify periods of market consolidation and the subsequent volatility expansions that follow.
This indicator combines two of the most powerful concepts in technical analysis: volatility cycles from Bollinger Bands and momentum tracking from the MACD.
This indicator is exceptionally useful for intraday traders who want to avoid the pitfalls of trading in choppy, sideways markets.
Blue bars signal a neutral or range-bound environment where price action is flat.
When momentum builds, the histogram shifts to green for bullish energy or red for bearish pressure.
This dual-indicator approach ensures that you aren’t just seeing a price move, but a move backed by significant momentum and a volatility breakout.
Free Download
Download the “bollinger-squeeze-with-macd.mq4” MT4 indicator
Key Features
- Combines volatility-based Bollinger Band logic with MACD momentum for high-accuracy signals.
- Uses a three-color histogram system to distinguish between neutral, bullish, and bearish states.
- Identifies low-volatility “squeezes” where price is preparing for a significant directional break.
- Optimized for short-term trading techniques such as scalping and M15 day trading.
Indicator Chart
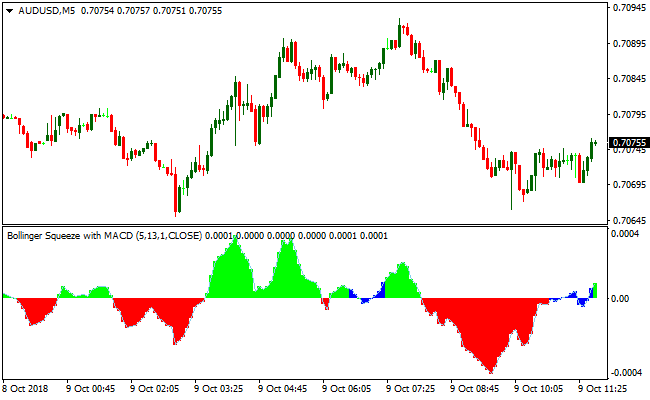
The Bollinger Bands Squeeze with MACD Indicator appears as a histogram in a separate window below the price candles.
Blue histograms indicate neutral areas where the market is flat and trading should be avoided.
Green histograms signify a shift into bullish territory, while red histograms indicate a bearish environment.
Guide to Trade with Bollinger Bands Squeeze with MACD Indicator
Buy Rules
- Monitor the histogram for the transition from neutral blue bars to green bars.
- Initiate a long trade when the indicator starts drawing green histogram bars above the zero level.
- Ensure the price action on the main chart is breaking out of a recent consolidation zone.
- Confirm the upward move with a higher timeframe trend filter to increase the probability of success.
Sell Rules
- Watch for the histogram bars to change from neutral blue to red.
- Initiate a short trade when the indicator begins drawing red histogram bars.
- Verify that the bars are gaining height, indicating that the bearish momentum is increasing.
- Execute the trade as soon as the first red bar is confirmed on the candle close.
Stop Loss
- Place the stop loss below the most recent swing low for buy positions.
- Position the stop loss above the most recent swing high for sell positions.
- Consider a larger stop loss during high-volatility sessions like the London and New York overlaps.
Take Profit
- Set the take profit at the next major support or resistance level on the chart.
- Close the position manually if the histogram turns blue, signaling that the momentum has faded.
Bollinger Bands Squeeze + SuperTrend MTF Strategy for MT4
This MT4 strategy combines the breakout momentum from the Bollinger Bands Squeeze with MACD indicator with the trend confirmation provided by the SuperTrend MTF Forex Signal indicator.
The Bollinger Bands Squeeze identifies periods of low volatility that often precede strong price movements.
Green histogram bars above zero indicate bullish pressure, while red bars above zero indicate potential bearish reversals.
The SuperTrend MTF indicator confirms the prevailing trend.
A green line signals a buy trend and a red line signals a sell trend. This combination ensures entries align with both momentum and trend direction.
The strategy works well on M5, M15, and H1 timeframes and is suitable for traders looking for clear breakout entries with trend validation.
It is particularly effective on major currency pairs and highly liquid cross pairs.
Buy Entry Rules
- Wait until the Bollinger Bands Squeeze starts drawing green histogram bars above zero, indicating bullish momentum.
- Confirm that the SuperTrend MTF line is green, signaling a buy trend.
- Open a long trade at the next candle open after confirmation.
- Place a stop loss below the recent swing low or just under the lower Bollinger Band.
- Set take profit at the next significant resistance level, previous swing high, or round number.
- Optionally use a trailing stop if the bullish trend remains strong.
Sell Entry Rules
- Wait until the Bollinger Bands Squeeze shows red histogram bars above zero, signaling potential bearish price action.
- Confirm that the SuperTrend MTF line is red, indicating a sell trend.
- Open a short trade at the next candle open after confirmation.
- Place a stop loss above the recent swing high or the upper Bollinger Band.
- Take profit at the next support zone, previous swing low, or psychological level.
- Use a trailing stop if downward momentum continues.
Advantages
- Combines volatility breakout with trend confirmation for higher probability trades.
- Works across multiple timeframes and currency pairs.
- Flexible take profit options allow adaptation to market conditions.
- Suitable for intraday scalping as well as short-term swing trades.
Drawbacks
- Trend confirmation may lag slightly, potentially delaying entries.
- Few trades occur because both momentum and trend conditions must align, which may not satisfy aggressive traders.
- Trailing stops require judgment, so beginners may struggle to apply them consistently.
- Sudden news events can trigger false breakouts or trend reversals.
Case Study 1
On EURUSD M15 during the London session, the Bollinger Bands Squeeze began drawing green histogram bars above zero after a brief consolidation.
The SuperTrend MTF line turned green at the same moment.
A long trade was opened at the next candle. Stop loss was placed 12 pips below the recent swing low.
Price rallied steadily over the next hour and reached a previous resistance level, giving a profit of 29 pips.
The trade followed all entry rules, confirmed momentum, and aligned with trend direction.
Case Study 2
On GBPJPY H1, price was consolidating inside Bollinger Bands.
The histogram turned red above zero and the SuperTrend MTF line switched to red, confirming bearish momentum.
A short trade was entered at the next candle. Stop loss was placed 15 pips above the recent swing high.
The pair moved downward toward the next H4 support area, achieving a 38 pip profit.
Strategy Tips
- Wait for both the histogram and SuperTrend line to confirm before entering a trade.
- Prefer trading during high liquidity sessions to maximize breakout potential.
- Adjust stop loss and take profit levels according to the timeframe and volatility of the currency pair.
- Use a trailing stop to lock in profits when the trend remains strong.
- Track which pairs and timeframes produce the most consistent results and focus on those setups.
- Limit daily trades to only the highest-quality setups that meet all entry criteria.
Download Now
Download the “bollinger-squeeze-with-macd.mq4” Metatrader 4 indicator
FAQ
What is the significance of the blue bars in this indicator?
The blue bars represent a “squeeze” or a neutral period.
During this time, Bollinger Bands are typically narrow, and the MACD lacks a clear directional bias.
Professional traders often use this as a signal to stay on the sidelines and wait for a green or red bar to appear, which marks the start of a valid breakout.
Does the indicator help in identifying trend reversals?
Yes, because it incorporates MACD logic, it is very sensitive to momentum shifts.
A change from a long series of green bars to red bars (passing through the neutral blue phase) is often a strong signal that the previous trend has exhausted and a reversal is starting.
Is this indicator suitable for trading high-impact news?
It is very useful for capturing the momentum that follows news releases.
The histogram will quickly shift from blue to a bright green or red, confirming that the news has triggered a significant market move.
Summary
The Bollinger Bands Squeeze with MACD Indicator is a powerful utility for anyone looking to trade volatility breakouts with precision.
By combining two legendary indicators, it provides a filtered view of the market that helps you avoid low-probability trades.
Its main benefit is the ability to show you not just where the price is going, but how much momentum is actually behind the move.
Integrating this histogram into your trading routine can significantly improve your ability to time entries during the start of a new trend.


