About the Snake Border Cloud Signal Indicator
The Snake Border Cloud Signal Indicator for MT4 is a dynamic trend-following tool designed to visualize momentum through two distinct colored trading zones.
This indicator uses an olive-colored zone as a baseline for market sentiment and a blue-colored zone, often referred to as the snake cloud, to track immediate price action.
By observing the interaction between these two areas, traders can identify when a new trend is forming or when a current move is gaining strength.
The cloud-based approach provides a smoother representation of market data compared to standard moving averages, helping to filter out minor price spikes and focusing on the core direction of the pair.
Free Download
Download the “borders-indicator.mq4” MT4 indicator
Key Features
- Features a unique dual-zone system to distinguish between core trend and active momentum.
- Uses olive and blue colored zones to provide an intuitive visual representation of market bias.
- Identifies high-probability entry points through zone crossovers and price positioning.
- Helps traders avoid volatile noise by smoothing out price fluctuations within the cloud.
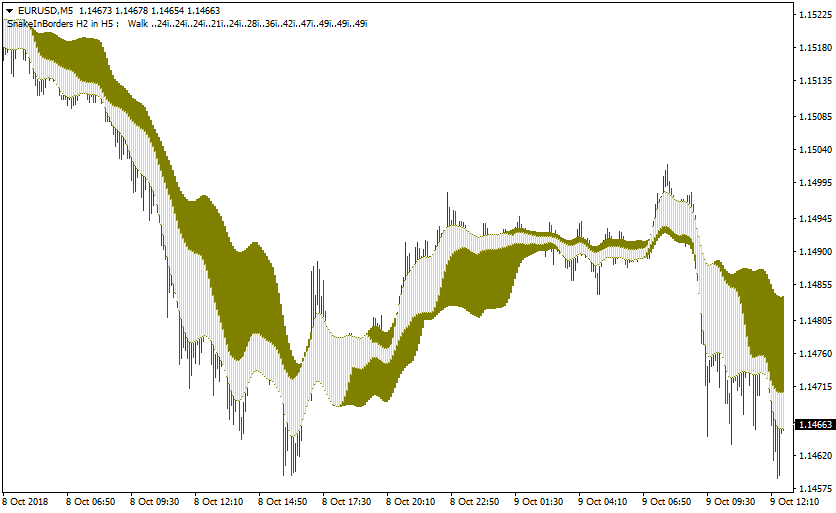
Indicator Chart
The Snake Border Cloud Signal Indicator displays two flowing zones directly on the price chart.
The olive zone serves as the primary border for the trend, while the blue snake cloud fluctuates around it.
A bullish environment is established when the blue cloud remains above the olive zone, whereas a bearish environment is signaled when the blue cloud stays below it.

Guide to Trade with Snake Border Cloud Signal Indicator
Buy Rules
- Observe the blue snake cloud as it moves relative to the olive trading zone.
- Wait for the blue colored trading zone to cross back above the olive colored zone from below.
- Ensure that the current price is trading above the olive colored trading zone for confirmation.
- Initiate a long trade once the crossover and price position are established on a closed candle.
Sell Rules
- Monitor the chart for the blue snake cloud to move toward the olive zone from above.
- Wait for the blue colored trading zone to cross back below the olive colored zone.
- Confirm that the market price is trading below the olive colored trading zone.
- Execute a short trade as soon as the downward crossover is visually confirmed.
Stop Loss
- Place the stop loss a few pips below the lower border of the olive zone for buy trades.
- Position the stop loss slightly above the upper border of the olive zone for sell trades.
- Adjust the exit point to account for the average volatility of the currency pair being traded.
Take Profit
- Target a fixed profit level that matches a 1:2 reward-to-risk ratio based on the entry candle.
- Consider closing the position if the blue snake cloud touches or enters the olive zone from the opposite side.
- Exit the trade manually at major horizontal support or resistance levels identified on the hourly chart.
Snake Border Cloud + XTC Trend Oscillator Forex Strategy for MT4
This MT4 strategy combines the cloud zone signals of the Snake Border Cloud Signal indicator with the momentum trend filter from the XTC Forex Trend Indicator.
The Snake Border Cloud highlights moments when price shifts from one zone into another, which often marks the beginning of a new trend.
The XTC Trend histogram confirms whether momentum supports the direction of the breakout.
The strategy works well on M5, M15, and H1. It is suitable for intraday traders who want clean and structured signals.
It helps avoid unnecessary trades by waiting for both the zone transition and momentum confirmation.
It can be applied on most major or cross pairs as long as clean zone movement is visible.
Buy Entry Rules
- Wait for the Snake Border Cloud blue trading zone to move up above the olive zone with price closing above the olive zone.
- Confirm that the XTC Trend histogram turns blue at the same moment or just after.
- Enter a buy at the opening of the next candle.
- Place a stop loss a few pips below the recent swing low or below the lower edge of the olive zone.
- Set take profit at a one to two risk reward target or target the next meaningful resistance level.
- A trailing stop can also be used if momentum remains strong.
Sell Entry Rules
- Wait for the Snake Border Cloud blue zone to drop under the olive zone and for price to close below the olive zone.
- Confirm that the XTC Trend histogram turns red.
- Open a sell position at the next candle open.
- Place a stop loss above the recent swing high or above the upper boundary of the zone that was crossed.
- Take profit at a one to two risk reward setup or target the next support level.
- A trailing stop works well when bearish momentum continues.
Advantages
- Combines price zone transitions with momentum confirmation which reduces many weak signals that appear in choppy markets.
- Signals are clear and easy to understand when price shifts from one zone to another.
- Works with many currency pairs and timeframes.
- Flexible take profit options make it suitable for short or extended moves.
- Risk is defined clearly through structural stop placement.
Drawbacks
- Momentum confirmation can arrive late, reducing the distance available for a profitable move.
- The strategy produces fewer signals because both indicators must align, so impatient or aggressive traders may find it restrictive.
- Trailing stops require judgment and timing, so beginners may struggle to apply them with consistency.
Case Study 1
On EURUSD M15 during the New York session, the pair moved inside the Snake Border Cloud zones without a clear direction.
A shift appeared when the blue zone pushed above the olive zone and the candle closed firmly above that area.
At the same moment, the XTC Trend histogram printed blue bars, signaling that bullish momentum had entered the market.
A long trade was opened at the next candle.
Stop loss was placed 10 pips below the lower olive zone and a one to two risk reward target was selected.
As the session progressed, EURUSD climbed steadily toward a resistance level visible on the H1 chart.
The take profit was triggered at 26 pips.
This trade followed all rules: full zone transition, momentum confirmation, structured stop placement, and exit at a clear resistance level.
Case Study 2
On USDCHF H1, the pair had been ranging for several hours.
A bearish transition started when the blue cloud zone dropped below the olive zone and price closed under the zone.
XTC Trend quickly printed red bars, showing that bearish pressure had taken control.
A short entry was taken at the opening of the next candle.
The stop loss was positioned 14 pips above the upper boundary of the cloud.
The take profit goal was set at the next higher timeframe support level for a one to three risk reward structure.
Over the next few hours, USDCHF fell sharply during increased market activity.
Price reached the projected H4 support area and the trade closed with a 42 pip profit.
Strategy Tips
- Avoid entries when the zone shift is unclear or when price is stuck inside overlapping zones.
- On volatile pairs, use slightly wider stops but balance them with higher take profit targets.
- Use a trailing stop only when the XTC histogram continues to support the trade direction.
- Avoid trading around major economic releases because price may cut through zones without commitment.
- Test the strategy on multiple pairs and then focus on those that produce the clearest zone transitions.
- Limit the number of trades each day and wait only for full alignment of both indicators.
Download Now
Download the “borders-indicator.mq4” Metatrader 4 indicator
FAQ
What is the “Snake Cloud” in this indicator?
The snake cloud is the blue-colored trading zone that follows the price more closely than the olive border.
It acts as a sensitive momentum gauge.
When it moves away from the olive zone, it indicates that the trend is accelerating.
When it moves back toward the olive zone, it suggests that the current momentum is fading or a reversal might be imminent.
Does the indicator repaint its zones?
The Snake Border Cloud Signal Indicator is designed to provide reliable signals based on completed price data.
To maintain accuracy, you should always wait for the current candle to close before confirming a crossover signal.
This ensures that the position of the blue cloud relative to the olive zone is fixed for that period.
Summary
The Snake Border Cloud Signal Indicator is an excellent tool for traders who prioritize visual clarity and trend momentum.
Its strength lies in its ability to highlight the most active parts of a trend while keeping you on the right side of the market.
For the best results, use this indicator as a core part of a disciplined trading plan.
Combining its signals with basic price action or support and resistance levels can further enhance its effectiveness.


