
About the Ascending/Descending Chart Pattern Indicator
The Ascending/Descending Chart Pattern Indicator for MT4 is an advanced technical utility designed to automate the recognition of triangle formations.
In the forex market, ascending and descending triangles represent critical periods of consolidation where price is compressed before a major volatility expansion.
This indicator scans the price action in real time, drawing the support and resistance lines that form these triangles and highlighting the exact moment a breakout occurs.
By removing the subjectivity of manual charting, it ensures that traders can identify these powerful patterns with consistent accuracy across multiple pairs.
Whether you are a day trader or a swing trader, this indicator simplifies the transition from market analysis to trade execution.
Free Download
Download the “breakout-pattern.mq4” MT4 indicator
Key Features
- Automatically identifies and draws ascending and descending triangle patterns on any timeframe.
- Generates clear blue and red arrows to signal long and short breakout opportunities.
- Calculates the potential target price based on the specific height of the identified pattern.
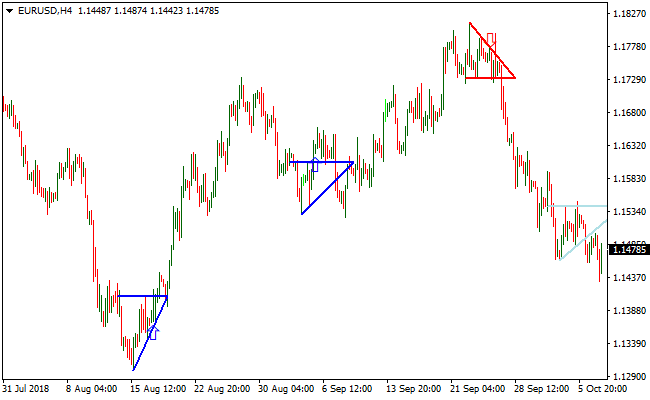
Indicator Chart
The Ascending/Descending Chart Pattern Indicator displays directly on the main activity chart.
It outlines triangle formations using trendlines to show the narrowing price range.
When a breakout is confirmed, the indicator plots a blue arrow for bullish moves or a red arrow for bearish moves.
Guide to Trade with Ascending/Descending Chart Pattern Indicator
Buy Rules
- Watch for the indicator to draw an ascending triangle or a symmetrical consolidation pattern.
- Wait for a blue arrow to appear, signaling a bullish breakout above the resistance line.
- Ensure the breakout candle closes outside the pattern to confirm the validity of the move.
- Initiate a long position at the start of the following candle.
Sell Rules
- Monitor the chart for a descending triangle formation highlighted by the indicator.
- Execute a short trade when a red arrow appears, indicating a downward break of support.
- Verify that the broader market sentiment aligns with a bearish continuation or reversal.
- Enter the position once the breakout is visually confirmed by the arrow and candle close.
Stop Loss
- For buy trades, set a stop-loss a few pips below the low price of the chart pattern.
- For sell trades, set a stop-loss a few pips above the high price of the chart pattern.
- Maintain these levels to protect against a failed breakout or a sudden return to the pattern range.
Take Profit
- For a buy trade, calculate the target by adding the total pattern height to the entry price.
- For a sell trade, calculate the target by subtracting the total pattern height from the entry price.
- Consider trailing your stop-loss as the price approaches the projected target to lock in gains.
Ascending/Descending Pattern + HalfTrend Arrow Strategy for MT4
This MT4 strategy blends chart-pattern signals from the Ascending/Descending Chart Pattern Indicator with trend confirmation from the HalfTrend 1.02 with Arrows Indicator.
The goal is to capture moves right when a chart pattern arrow signals a potential reversal or continuation, and confirm that move with the smoother trend arrow from HalfTrend.
This combination works well on lower to medium timeframes like M5, M15 or H1, and is suitable for traders who want clarity through pattern and trend alignment.
By requiring both a pattern-based arrow and a trend arrow, the chance of random noise or false entries is reduced.
The strategy targets traders interested in intraday or short-term swing moves across varied currency pairs.
Buy Entry Rules
- Wait for a blue arrow from the Ascending/Descending Pattern indicator to appear (pattern suggests upward reversal or continuation).
- Confirm that the HalfTrend indicator shows a blue arrow (indicating bullish trend) at the same time or just after the pattern arrow.
- Open a long trade on the candle closing with both arrows or at the next open if confirmation holds.
- Place a stop loss a few pips under the recent swing low or just below the last significant support.
- Set take profit at the next resistance zone or aim for a defined target (for example, 20–40 pips depending on timeframe and pair).
- Optionally apply a trailing stop if price moves in your favor.
Sell Entry Rules
- Wait for a red arrow from the Ascending/Descending Pattern indicator (pattern points to downward reversal or continuation).
- Confirm that the HalfTrend indicator shows a magenta arrow (indicating bearish trend) simultaneously or shortly after.
- Open a short trade on the candle close with both arrows or at the next candle open if confirmation holds.
- Place a stop loss a few pips above the recent swing high or above the last significant resistance.
- Take profit at the next support zone or set a target (e.g. 20–40 pips), or trail stop as price moves in your favor.
Advantages
- Pattern-based arrows provide pre-defined setups; the trader doesn’t need to draw manually.
- HalfTrend adds trend direction confirmation, reducing false signals during choppy periods.
- Combining pattern and trend makes entries more selective and potentially higher quality.
- Flexible enough to apply on different pairs and timeframes depending on trading style.
- Good for intraday or short swing trades, offering a balance between reactivity and confirmation.
Drawbacks
- If the market is highly volatile or news-driven, pattern arrows may appear but the trend may reverse quickly, hitting the stop loss.
- The need for dual confirmation (pattern + trend) reduces the frequency of trades; many potential moves are skipped.
- On higher timeframes, signals may come too late, reducing profit potential and making stop losses wider.
Case Study 1
On EURJPY M15 during a calm European session, the Ascending/Descending Pattern indicator generated a blue arrow after a short downward move.
The price had formed a small bottom pattern.
At almost the same time, HalfTrend showed a blue arrow confirming a bullish trend.
A long position was opened at the close of that candle.
The stop loss was placed just below the recent swing low. Over the next several candles price rose steadily.
The trade was closed near a prior resistance level, yielding about 30 pips.
Case Study 2
On GBPUSD H1, after a pullback inside a broader downtrend, the Ascending/Descending Pattern indicator produced a red arrow suggesting bearish continuation.
The HalfTrend indicator displayed a magenta arrow around the same time.
A short trade was entered at the next candle open.
The stop loss was placed just above the recent swing high.
Price moved downward gradually over the following hours before reaching the next support zone, offering a profit of roughly 45 pips.
Strategy Tips
- Prefer trading during active market sessions for stronger directional moves rather than during quiet times when the market tends to chop.
- Use tighter stop losses on lower timeframes and slightly wider ones on higher timeframes to accommodate volatility.
- If price moves strongly but stalls near resistance/support, consider partial closure or a trailing stop to lock in profits.
- Don’t overtrade: wait for high-quality setups and avoid forcing trades when arrows align in unclear market conditions.
Download Now
Download the “breakout-pattern.mq4” Metatrader 4 indicator
FAQ
How is the target price determined for triangle breakouts?
The target is based on the vertical height of the triangle at its widest point.
This is a classic technical analysis rule that suggests the price will travel a distance equal to the height of the pattern once the breakout occurs.
The Ascending/Descending Chart Pattern Indicator automates this calculation for you.
Can I use this indicator on the 5-minute timeframe?
Yes, the indicator is effective on lower timeframes for scalping, though the patterns carry more weight on the H1 or H4 charts.
When trading on the M5, it is advisable to confirm the breakout with higher volume or session opens to ensure the move has enough momentum to reach the calculated target.
What should I do if the price moves back into the triangle after a signal?
If the price closes back inside the triangle boundaries, the breakout may be a “fakeout.”
This is why the indicator provides specific stop-loss levels based on the pattern’s extremes.
Summary
The Ascending/Descending Chart Pattern Indicator is an excellent tool for traders who value structural price action and breakout strategies.
Automating the detection of triangles and providing clear entry and exit rules brings a professional level of discipline to your trading.
Its primary benefit is the ability to quantify potential profits and risks before you even enter the market.
To maximize your results, always consider the overall trend when taking breakout signals.
Trading a bullish triangle breakout in an established uptrend significantly increases your probability of success.


