About the Channel Breakout Entry Indicator
The Channel Breakout Entry indicator for MT4 provides precise buy and sell entry signals based on channel direction and price movement.
It consists of a dynamic trading channel and a blue entry line, allowing traders to spot opportunities in trending markets.
A rising channel is formed when the channel makes higher highs and higher lows, indicating an uptrend.
A declining channel is formed when the channel makes lower highs and lower lows, indicating a downtrend.
Buy entries occur when the price crosses above the blue entry line during an uptrend, while sell entries occur when the price crosses below the blue line during a downtrend.
The indicator works as a standalone tool or in combination with other analysis techniques and fits all trading styles.
All default parameters can be customized in the inputs menu.
Free Download
Download the “channel-breakout-entry.mq4” MT4 indicator
Key Features
- Dynamic trading channel with two red lines indicating trend direction.
- Blue entry line for precise buy and sell entries.
- Rising channel signals uptrend; declining channel signals downtrend.
- Flexible for all trading styles and timeframes.
- All indicator settings fully adjustable via the inputs menu.
Indicator Chart
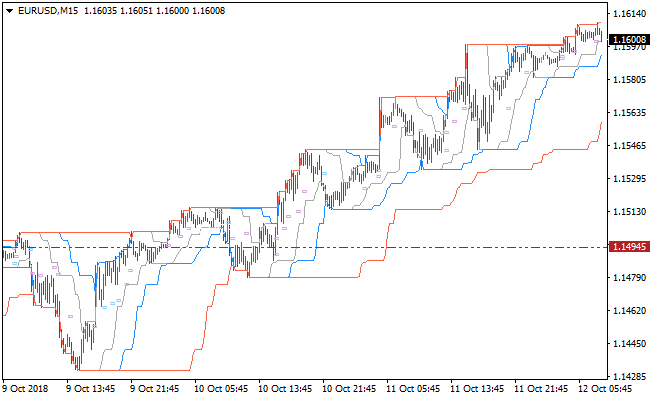
The Channel Breakout Entry indicator is shown below, marking potential buy and sell entries within the dynamic channel.
The rising channel highlights bullish conditions, while the declining channel highlights bearish conditions.
Traders can visually follow the channel and entry line to make timely entries aligned with the market trend.
Using the channel direction ensures trades are taken with the prevailing trend, improving the probability of successful trades.

Guide to Trade with the Channel Breakout Entry Indicator
Buy Rules
- Confirm the trading channel is rising, showing an uptrend.
- Wait for the price to cross above the blue entry line from below.
- Enter a buy trade at the close of the confirming candle.
- Ignore buy signals if the channel is flat or declining.
Sell Rules
- Confirm the trading channel is declining, showing a downtrend.
- Wait for the price to cross below the blue entry line from above.
- Enter a sell trade at the close of the confirming candle.
- Ignore sell signals if the channel is flat or rising.
Stop Loss
- For buy trades, place the stop loss slightly below the recent swing low or the lower channel line.
- For sell trades, place the stop loss slightly above the recent swing high or the upper channel line.
Take Profit
- Close buy trades when the price reaches the upper channel boundary or shows signs of reversal.
- Close sell trades when the price reaches the lower channel boundary or shows signs of reversal.
- Optionally, use nearby support or resistance levels for partial profit-taking.
Channel Breakout Entry + Precision Trend Histogram Forex Day Trading Strategy
This MT4 strategy combines breakout signals from the Channel Breakout Entry Indicator with trend confirmation from the Precision Trend Buy/Sell Histogram Indicator.
The Channel Breakout Entry signals a buy when the currency pair crosses back above the blue entry line from below while the channel is rising, and a sell when the price crosses below the blue line from above while the channel is falling.
The Precision Trend Histogram shows the trend direction with green bars for upward momentum and red bars for downward momentum.
By combining these tools, traders can filter out false breakouts and enter trades aligned with the prevailing trend, which is ideal for day trading on timeframes such as M15 and M30.
This strategy works best on liquid pairs like EUR/USD, GBP/USD, USD/JPY, and AUD/USD.
Buy Entry Rules
- The trading channel must be rising, indicating an uptrend.
- The currency pair must cross back above the blue entry line from below.
- The Precision Trend Histogram must show green bars.
- Enter a buy order at the close of the confirming candle.
- Place a stop loss below the most recent swing low or below the lower boundary of the channel.
- Set take profit at the next visible resistance level or previous swing high.
Sell Entry Rules
- The trading channel must be falling, indicating a downtrend.
- The currency pair must cross back below the blue entry line from above.
- The Precision Trend Histogram must show red bars.
- Enter a sell order at the close of the confirming candle.
- Place a stop loss above the most recent swing high or above the upper boundary of the channel.
- Set take profit at the next visible support level or previous swing low.
Advantages
- Breakout entries combined with trend confirmation reduce false signals.
- The histogram provides a clear visual trend filter for decision-making.
- Works well on liquid pairs with intraday volatility.
- Simple rules allow for consistent day trading execution.
- Focus on actual price action and trend alignment instead of fixed risk/reward.
Drawbacks
- Sideways or choppy markets may produce multiple false breakouts.
- Requires monitoring to catch timely breakout entries.
- Sudden volatility can hit stops before momentum develops.
- Lower timeframes demand attention and quick execution for scalps.
Example Case Study 1 – EUR/JPY M15
During the Asian session, EUR/JPY formed a rising channel.
The price crossed back above the blue entry line at 144.25 and the Precision Trend Histogram showed green bars.
A buy order was entered at 144.25. Stop loss was set at 144.05 below the recent swing low.
The price moved upward and reached the previous swing high at 144.70, producing a profit of 45 pips.
The histogram remained green, confirming the uptrend throughout the trade.
Example Case Study 2 – AUD/USD M30
AUD/USD during the London session was in a falling channel.
The price crossed below the blue entry line at 0.6740 and the histogram displayed red bars.
A sell order was placed at 0.6740. Stop loss was set at 0.6755 above the recent swing high.
Price moved downward to the next support at 0.6718, capturing 22 pips.
Strategy Tips
- Use the strategy on major and liquid currency pairs for better price execution.
- Focus on the London and New York sessions for stronger breakout moves.
- Do not enter trades if the histogram does not confirm the channel breakout direction.
- Watch for key support and resistance levels to determine take profit points rather than using fixed ratios.
Download Now
Download the “channel-breakout-entry.mq4” Metatrader 4 indicator
FAQ
Can the Channel Breakout Entry be used alone?
Yes, it can be used as a standalone tool, but combining it with other trend confirmation indicators can improve accuracy.
Does the indicator work on all timeframes?
Yes, it works on all timeframes. Lower timeframes are useful for scalping, while higher timeframes help identify broader trends.
Are the channel and entry line adjustable?
Yes, all indicator parameters, including channel and entry line settings, can be customized through the inputs menu.
Summary
The Channel Breakout Entry indicator identifies buy and sell opportunities based on price interaction with a dynamic trading channel and entry line.
It helps traders take positions in the direction of the prevailing trend, improving trade accuracy and timing.
By following the channel’s direction and using the blue entry line as a guide, traders can enter high-probability trades and manage risk effectively.
It is suitable for scalping, intraday, and swing trading across all MT4 instruments.


