
About the Curver Buy/Sell Arrows Indicator
The Curver Buy/Sell Arrows indicator for MT4 is a stop and reverse trading system designed to generate direct buy and sell signals on the price chart.
It uses colored arrows to mark potential trend changes and short-term entry opportunities.
This makes it practical for traders who prefer straightforward decision-making without complex analysis.
Blue arrows signal bullish conditions and suggest buy opportunities, while red arrows highlight bearish pressure and suggest sell trades.
In addition to arrow signals, the indicator plots two Curver bands around the price.
These bands adapt to market movement and offer natural reference points for managing exits.
The Curver Buy/Sell Arrows indicator performs best in trending conditions where price moves consistently in one direction.
In ranging markets, signals may appear more frequently but require stricter trade management.
All indicator parameters can be adjusted, allowing traders to fine-tune responsiveness based on their trading style.
Free Download
Download the “curver-arrows.mq4” MT4 indicator
Key Features
- Stop and reverse logic based on arrow signals.
- Blue arrows for buy setups and red arrows for sell setups.
- Dynamic Curver bands for take profit guidance.
- Works across all currency pairs and timeframes.
- Fully adjustable indicator input settings.
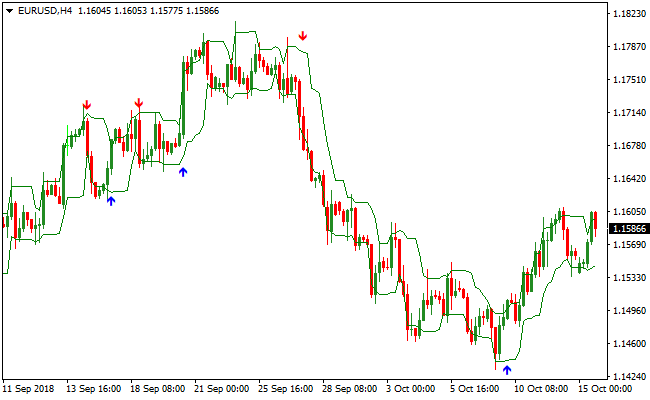
Indicator Chart
The image below shows the Curver Buy/Sell Arrows indicator applied to a live price chart.
Colored arrows mark potential entry points while the Curver bands highlight logical exit zones.
The chart demonstrates how signals react to trend changes.
Guide to Trade with the Curver Buy/Sell Arrows Indicator
Buy Rules
- Wait for a blue arrow to appear on the price chart.
- Confirm that the price is not trapped in a tight consolidation.
- Enter a buy trade at the close of the signal candle.
- Ignore buy signals that appear directly into resistance.
Sell Rules
- Wait for a red arrow to appear on the price chart.
- Confirm that downside momentum is present.
- Enter a sell trade at the close of the signal candle.
- Ignore sell signals that appear directly into support.
Stop Loss
- For buy trades, place the stop loss below the lower Curver band.
- For sell trades, place the stop loss above the upper Curver band.
Take Profit
- Close buy trades when price reaches the upper Curver band.
- Close sell trades when price reaches the lower Curver band.
- Exit the trade if an opposite arrow prints on the chart.
Curver Arrows + Kaufman Bands Forex Scalping Strategy
This MT4 strategy uses the Curver Buy Sell Arrows Metatrader 4 Forex Indicator together with the Kaufman Bands Metatrader 4 Forex Indicator.
The Curver indicator provides clear buy (blue arrow) and sell (red arrow) signals.
The Kaufman Bands help identify the overall trend: when the bands slope upward, the market tends to be bullish; when they slope downward, bearish.
This combination offers both precise entries and trend‑direction context, reducing the risk of counter‑trend trades.
This strategy works best on low to medium time frames such as 5‑minute (M5) or 15‑minute (M15) charts.
Use during active forex sessions when volatility is moderate to high, and focus on major currency pairs for more reliable band behaviour and liquidity.
Buy Entry Rules
- Wait until the Kaufman Bands are sloping upward (indicating a bullish trend).
- Then wait for a blue arrow from the Curver indicator (buy signal).
- Enter a buy trade when both conditions are met.
- Set stop loss a few pips below the recent swing low or below the lower band.
- Set take profit to 15–25 pips, or use a trailing stop as price moves in your favor.
Sell Entry Rules
- Wait until the Kaufman Bands are sloping downward (indicating a bearish trend).
- Then wait for a red arrow from the Curver indicator (sell signal).
- Enter a sell trade under those conditions.
- Place a stop loss a few pips above the recent swing high or above the upper band.
- Take profit around 15–25 pips, or trail stop to ride stronger moves.
Advantages
- Combines a clear entry signal (arrows) with a trend direction filter (bands) for higher reliability.
- No complicated indicators, easy signals for beginners or scalpers.
- Adaptable to multiple time frames (M5, M15) depending on your risk appetite and trading style.
- Helps avoid trades against the main trend, reducing whipsaws and false signals.
- Allows scalping with reasonable risk‑reward when done carefully and with discipline.
Drawbacks
- May underperform during sideways or ranging markets, when the band slope is flat and signals are confusing.
- Frequent monitoring is required due to the short time frame and quick trades.
- Small profit per trade.
Case Study 1
On EUR/JPY, 5‑minute chart: The Kaufman Bands began sloping up after a consolidation phase.
A blue arrow appeared from the Curver indicator.
A buy order was placed at 143.25 with a stop loss at 143.10 (below the recent swing low).
The price climbed steadily buying momentum and reached 143.50 before showing signs of slowing.
The trade was closed at +25 pips.
The band slope confirmed a bullish trend and avoided earlier sideways noise.
Case Study 2
On AUD/USD, 15‑minute chart: The Kaufman Bands started sloping down indicating bearish bias.
A red arrow from the Curver indicator appeared at 0.6740.
A sell order was opened with a stop loss at 0.6755 (just above the recent swing high) and take profit set to 0.6715.
The market dropped as expected and touched the target for +25 pips.
Strategy Tips
- Test this setup first on a demo account to understand band behaviour on different currency pairs and time frames.
- Prefer trading during liquid market sessions.
- Avoid trading when bands are flat or show no clear slope. Save trades for trending conditions only.
- Be disciplined with stop loss and take profit levels. Avoid greed, especially on quick scalping trades.
Download Now
Download the “curver-arrows.mq4” Metatrader 4 indicator
FAQ
Is the Curver Buy/Sell Arrows indicator a trend system?
Yes, it works as a stop and reverse system that follows directional movement.
It performs strongest when price trends cleanly and produces fewer false signals.
In sideways markets, traders may need tighter risk control.
Can the Curver bands be used alone for exits?
The Curver bands are designed to act as dynamic take profit zones.
They adjust with market movement and reflect short-term price expansion.
Many traders rely on them as primary exit targets.
Summary
The Curver Buy/Sell Arrows indicator provides a direct and practical way to trade market direction.
Its arrow-based signals remove guesswork, while the Curver bands assist with disciplined exits.
This combination supports traders who value simplicity and responsiveness.
When used in trending conditions, the indicator delivers consistent trade opportunities with clear rules.
With adjustable settings and flexible exit options, it fits a wide range of trading styles.
It remains a solid choice for traders seeking a stop and reverse approach.


