
About the Bitcoin Trader indicator
The Bitcoin Trader indicator for MT4 is a trend-following tool designed to generate buy and sell signals for Bitcoin and other cryptocurrencies.
It analyzes price movement and displays a single signal line that changes color based on market direction.
This makes it easy to identify whether bullish or bearish conditions are currently in control.
When the indicator turns blue, it signals a bullish trend and suggests looking for buying opportunities.
When the line turns yellow, it reflects bearish conditions and signals potential selling opportunities.
This color-based logic keeps decision-making simple and avoids unnecessary complexity.
The indicator can be applied to any timeframe, allowing traders to adapt it to short-term trading or longer-term trend analysis.
Its settings are fully adjustable, making it possible to fine-tune responsiveness based on market behavior.
While it was designed with Bitcoin in mind, the indicator also works effectively on other major cryptocurrencies.
Free Download
Download the “Bitcoin-Trader.ex4” MT4 indicator
Key Features
- Color-changing signal line to indicate bullish and bearish trends.
- Works on any timeframe selected by the trader.
- Fully adjustable settings for signal sensitivity.
- Designed for Bitcoin but compatible with other cryptocurrencies.
- Simple logic that supports fast trading decisions.
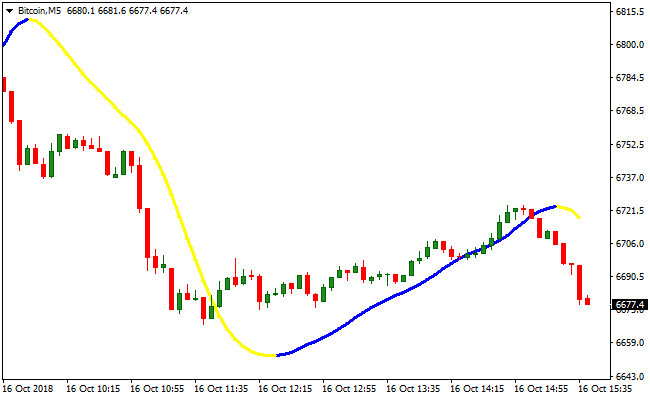
Indicator Chart
The image displays the Bitcoin Trader indicator applied to a cryptocurrency price chart.
The signal line switches between blue and yellow to reflect trend direction.
Buy and sell decisions are based on these color changes, allowing traders to follow momentum without complex analysis.
Guide to Trade with the Bitcoin Trader indicator
Buy Rules
- Wait for the indicator signal line to change from yellow to blue.
- Confirm that price is moving in the same upward direction.
- Open a buy trade at the close of the color-change candle.
- Avoid buying during low-volatility consolidation phases.
Sell Rules
- Wait for the indicator signal line to change from blue to yellow.
- Confirm that downside momentum is present.
- Open a sell trade at the close of the color-change candle.
- Skip trades if price action remains choppy.
Stop Loss
- Place the stop loss 2-3 pips below the most recent swing low for buy trades.
- Place the stop loss 2-3 pips above the most recent swing high for sell trades.
Take Profit
- Close the entire buy trade when the signal line turns yellow.
- Close the entire sell trade when the signal line turns blue.
- Trail profits if the trend remains strong.
Bitcoin Trader Indicator + Fibonacci MTF Channel Strategy for Crypto Trading
This strategy combines the precision of the Bitcoin Trader MT4 Indicator with trend analysis from the Fibonacci MTF Channel MT4 Indicator.
The Bitcoin Trader indicator signals buy or sell opportunities with a blue or yellow line.
The Fibonacci MTF Channel confirms the overall trend with an upward sloping channel indicating a buy trend and a downward sloping channel indicating a sell trend.
This combination allows traders to enter high-probability positions by aligning momentum signals with the channel trend.
The strategy works best on M15 and H1 charts, providing enough reaction time for crypto volatility while allowing multiple intraday setups.
Trades are taken only when the signal line direction aligns with the channel slope, reducing false entries in volatile markets.
Buy Entry Rules
- The Fibonacci MTF Channel is upward sloping, confirming a bullish trend.
- The Bitcoin Trader MT4 Indicator shows a blue line, indicating a buy signal.
- Enter a buy trade at the close of the signal candle or the next candle open.
- Place a stop loss below the lower boundary of the channel or recent swing low.
- Take profit at the next swing high or exit if the Bitcoin Trader indicator switches to a yellow sell line.
Sell Entry Rules
- The Fibonacci MTF Channel is downward sloping, confirming a bearish trend.
- The Bitcoin Trader MT4 Indicator shows a yellow line, indicating a sell signal.
- Enter a sell trade at the close of the signal candle or the next candle open.
- Place a stop loss above the upper boundary of the channel or recent swing high.
- Take profit at the next swing low or exit if the Bitcoin Trader indicator switches to a blue buy line.
Advantages
- Combines momentum signals with trend confirmation for higher probability entries.
- Suitable for volatile crypto markets like Bitcoin and Ethereum.
- Flexible take profit and stop loss placement based on channel boundaries and swing levels.
- Can be applied on multiple timeframes to match trading style and risk tolerance.
Drawbacks
- Crypto markets are highly volatile, and sudden spikes may trigger stop losses before trend continuation.
- Waiting for alignment between the signal and channel may reduce the number of trade opportunities.
- News events or market sentiment changes can cause false signals.
- Requires monitoring during active hours due to rapid price movements in cryptocurrencies.
Case Study 1 – Buy Trade on Bitcoin (BTCUSD) H1
During a New York session, the Fibonacci MTF Channel for BTCUSD was sloping upward.
The Bitcoin Trader indicator generated a blue buy line at 58,200.
A buy trade was opened at 58,200 with a stop loss at 57,750 near the channel’s lower boundary.
Price moved upward to 59,100, and the trade was closed for a gain of 900 points.
Combining trend confirmation with the buy signal captured a strong intraday move.
Case Study 2 – Sell Trade on Ethereum (ETHUSD) H1
On ETHUSD, the Fibonacci MTF Channel was sloping downward.
The Bitcoin Trader indicator showed a yellow sell line at 4,020.
A sell trade was placed at 4,020 with stop loss at 4,080 above the channel upper boundary.
Price declined to 3,920, and the trade was closed for a profit of 100 points.
Strategy Tips
- Focus on high liquidity periods for cryptocurrencies to reduce slippage and increase trade reliability.
- Use reasonable position sizing because crypto volatility can cause rapid price swings.
- Wait for full confirmation of both signal and channel direction before entering a trade.
- Adjust stop loss and take profit according to the channel width and market volatility.
- Avoid trading during major crypto news or announcements to reduce the risk of sudden spikes.
- Test the strategy on a demo account to understand signal timing and channel behavior for different cryptocurrencies.
Download Now
Download the “Bitcoin-Trader.ex4” Metatrader 4 indicator
FAQ
Can the Bitcoin Trader indicator be used on altcoins?
Yes. The indicator works on other cryptocurrencies such as Ethereum and Ripple, as long as sufficient price movement is present.
Which timeframe is best for this indicator?
The indicator adapts to any timeframe. Higher timeframes often produce smoother signals, while lower timeframes generate more frequent trades.
Do the indicator settings need adjustment?
Default settings work well in many cases, but adjusting sensitivity can improve performance depending on market volatility.
Summary
The Bitcoin Trader indicator provides a straightforward way to follow cryptocurrency trends using color-based signals.
Its simple logic makes it easy to interpret, even during fast-moving markets.
The indicator works well for traders who prefer trend-following strategies and flexible timeframe selection.
While combining it with additional confirmation tools may enhance consistency, it already delivers a practical foundation for trading Bitcoin and other cryptocurrencies.


