About the Directional Breakout indicator
The Directional Breakout indicator for MT4 is a momentum-based trading tool built to detect short-term trend shifts as they develop.
It reacts quickly to changes in market direction, making it especially useful for scalping and intraday trading strategies where timing is critical.
The indicator uses a color-coded histogram to reflect bullish, bearish, and neutral market conditions.
When bullish momentum builds, the indicator plots green histogram bars above the zero level.
Bearish momentum is shown through red histogram bars below the zero level.
Yellow bars indicate a flat or transitional phase where price lacks clear direction.
The indicator performs best when aligned with a higher-timeframe trend filter.
By combining short-term momentum with a broader directional bias, traders can reduce false signals and concentrate on trades that follow market flow.
This makes the indicator suitable for traders who prefer precision entries rather than constant market exposure.
Free Download
Download the “directional-breakout-indicator.mq4” MT4 indicator
Key features
- Fast-reacting momentum histogram for short-term trading.
- Color-coded bars showing bullish, bearish, and flat conditions.
- Clear zero-level reference for trend direction.
- Works well with moving average trend filters.
- Suitable for scalping and day trading strategies.
Indicator chart
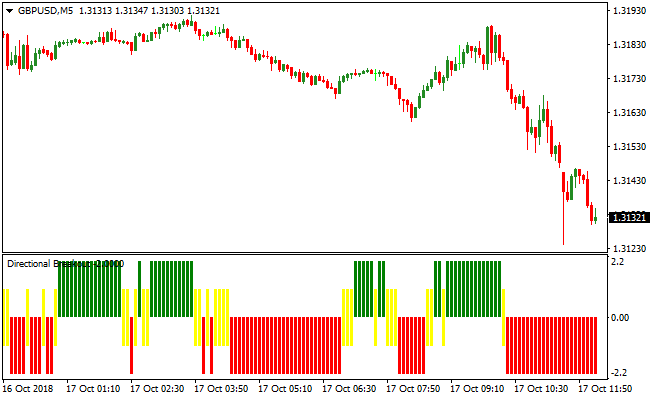
The image below shows the Directional Breakout indicator displayed in a separate window below the main price chart.
The histogram bars change color to reflect bullish, bearish, and flat market conditions, helping traders identify breakout opportunities in real time.

Guide to trade with the Directional Breakout indicator
Buy rules
- Confirm that price is trading above a higher-period moving average.
- Wait for the histogram to shift from yellow to green.
- Ensure the green bars form above the zero level.
- Enter a buy trade at the close of the signal candle.
Sell rules
- Confirm that price is trading below a higher-period moving average.
- Wait for the histogram to shift from yellow to red.
- Ensure the red bars form below the zero level.
- Enter a sell trade at the close of the signal candle.
Stop loss
- Set the stop loss a fixed number of pips beyond the entry candle.
- Use the average range of recent candles to define the stop distance.
- Keep the stop outside short-term market noise.
- Exit the trade if price closes beyond the stop level.
Take profit
- Exit the trade when the histogram changes back to yellow.
- Close the position if an opposite color signal appears.
- Target nearby intraday support or resistance levels.
Directional Breakout + Forex Trend Candlestick Painter Day Trading Strategy
This strategy combines the breakout signal from the Directional Breakout MT4 Indicator with trend confirmation from the Forex Trend Candlestick Painter Indicator.
The Directional Breakout changes color from yellow to green or red to indicate breakout momentum.
The Candlestick Painter highlights bullish or bearish trend phases by coloring consecutive candlesticks green for an uptrend or red for a downtrend.
By combining the breakout signal with a clear trend color, this strategy aims to capture directional moves during active trading hours and avoid false breakout signals.
This strategy works best on 30-minute to 4-hour charts, making it suitable for day trading and intraday setups.
Trade entries are taken when both the breakout signal and trend alignment confirm a directional move.
This method helps reduce false signals and allows traders to stay with strong intraday or multi-hour moves with defined entries and exits.
Buy Entry Rules
- The Directional Breakout indicator changes color from yellow to green, signaling breakout momentum upward.
- Forex Trend Candlestick Painter shows a series of green candlesticks, confirming a bullish trend context.
- Enter a buy trade at the close of the candle where the breakout color changed or at the open of the next candle.
- Place a stop loss a few pips below the recent swing low or below the breakout candle low.
- Set take profit at the next significant resistance level, prior swing high, or when trend color reverses from green to red.
Sell Entry Rules
- The Directional Breakout indicator changes color from yellow to red, signaling breakout momentum downward.
- Forex Trend Candlestick Painter shows a series of red candlesticks, confirming bearish trend context.
- Enter a sell trade at the close of the color change candle or at the open of the next candle.
- Place a stop loss a few pips above the recent swing high or above the breakout candle high.
- Take profit at the next support level, prior swing low, or when the candlestick painter changes from red to green.
Advantages
- Combines breakout momentum and trend confirmation to improve trade quality.
- Clear and simple rules, easy to apply on multiple currency pairs and timeframes.
- Trend confirmation helps avoid false breakouts that reverse quickly.
Drawbacks
- False breakouts can still occur during low volatility or consolidation periods, despite trend confirmation.
- Patience is required, as not every color change results in a strong breakout.
Case Study 1 – Buy Trade
On USDCHF H1 during the London and New York session, the price had been consolidating.
The Directional Breakout indicator switched from yellow to green at the end of the consolidation phase while the Candlestick Painter showed a green series of candles forming.
A buy trade was entered at the close of that breakout candle.
Stop loss was placed 12 pips below the recent swing low.
Price rallied strongly over the next few hours and reached a prior resistance zone, yielding a profit of approximately 68 pips.
Trend confirmation helped avoid a false breakout and captured a solid move.
Case Study 2 – Sell Trade
On EURJPY M30, after a minor retracement, the Directional Breakout changed from yellow to red while the Candlestick Painter displayed a series of red candles confirming bearish momentum.
A sell trade was executed at candle close with stop loss 8 pips above the recent swing high.
Price moved downward over the next several candles and hit a support zone, locking in a profit of about 54 pips.
The combined setup avoided noise and captured a clean intraday reversal.
Strategy Tips
- Prefer currency pairs with decent volatility like EURJPY, USDCHF, GBPUSD, and AUDUSD for clearer breakout moves.
- Adjust take profit levels based on recent support and resistance rather than fixed pip targets to suit each pair’s volatility.
- Consider closing part of the position at an intermediate target and trailing the stop on the rest to maximize gains while protecting profits.
- Test the strategy on a demo account first to find which pairs and timeframes match your trading style best.
Download Now
Download the “directional-breakout-indicator.mq4” Metatrader 4 indicator
FAQ
Which market conditions suit this indicator best?
The indicator performs best during active market hours when price is capable of producing short-term directional moves rather than prolonged consolidation.
Can the indicator be used without a trend filter?
It can be traded on its own, but performance improves when trades follow a higher-timeframe trend direction.
What do yellow histogram bars indicate?
Yellow bars signal a flat or transitional phase where momentum is unclear and new trades should generally be avoided.
Summary
The Directional Breakout indicator for MT4 is designed for traders who focus on short-term momentum and precise market entries.
Its color-based histogram simplifies trend detection and helps filter out low-probability conditions.
By combining fast breakout signals with a higher-timeframe bias, traders can improve timing and reduce unnecessary trades.
The indicator is easy to read, adaptable across timeframes, and works well for active trading styles that demand responsiveness and clarity.


