About the Doji Detector indicator
The Doji Detector indicator for MT4 is a specialized technical tool designed to scan the charts for one of the most significant price action formations: the Doji candlestick.
A Doji occurs when the opening and closing prices of an asset are virtually equal, resulting in a candle with a very small or non-existent body.
This formation represents a state of equilibrium and intense indecision between buyers and sellers.
When this indicator identifies such a pattern, it highlights the specific candle, allowing traders to pause and evaluate the potential for a shift in market sentiment.
Rather than manually scanning every bar, the tool provides immediate alerts when the market reaches a point of balance.
Free Download
Download the “doji-detector.mq4” MT4 indicator
Key Features
- Real-time scanning and detection of Doji candlestick patterns across any timeframe.
- Visual markers are placed directly on the chart to highlight points of market indecision.
- Helps identify potential trend exhaustion zones at major support and resistance levels.
- Simplifies price action trading by removing the subjectivity of identifying candle shapes.
Indicator Chart
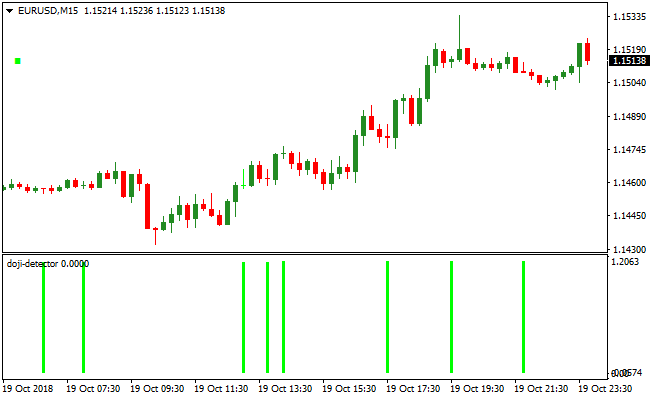
The chart demonstrates the Doji Detector indicator identifying key moments of price consolidation.
Each time the market reaches a point of balance where neither bulls nor bears can secure a lead, the indicator marks the candle.

Guide to Trade with the Doji Detector indicator
Buy Rules
- Observe the market during a clear and sustained downtrend.
- Wait for the Doji Detector indicator to mark a Doji candle at a known support level.
- Look for a bullish confirmation candle to close above the high of the identified Doji.
- Ensure that secondary indicators, such as the RSI or MACD, show bullish divergence or oversold conditions.
Sell Rules
- Monitor the price action during an established bullish trend.
- Locate a Doji pattern identified by the indicator near a significant resistance zone.
- Wait for the subsequent candle to break and close below the low of the Doji candlestick.
- Confirm the bearish bias with a trend-following tool or by observing a break in market structure.
Stop Loss
- For a buy position, place the stop-loss order just below the wick of the detected Doji candle.
- For a sell position, set the stop-loss order just above the high of the detected Doji candle.
- Adjust the stop-loss level to account for market volatility and spread.
Take Profit
- Set the primary take-profit target at the next major support or resistance level.
- Consider using a fixed risk-to-reward ratio of at least 1:2 to ensure long-term profitability.
- Exit the trade if the indicator detects another Doji in the opposite direction, suggesting new indecision.
Doji Detector and Trend Predictor Trading Strategy for MT4
This strategy is built around two helpful tools that work well together in market conditions where price creates short pauses before continuing in a clear direction.
The Doji Detector highlights Doji-style candles by marking them with a green bar. These candles often signal hesitation or a possible turning point.
The Trend Predictor V1.0 adds confirmation by placing a blue arrow for buy conditions and a red arrow for sell conditions.
When both indicators appear together, the setup becomes much stronger because the strategy waits for a pause followed by a clear directional push.
This method is easy to follow and works on timeframes from M15 to H1.
It fits intraday traders who want structured entries and clear rules without relying on complicated chart patterns.
The idea is simple.
You wait for a Doji style pause in the market, and then you trade in the direction confirmed by the Trend Predictor.
The combination filters out many weak signals and helps you focus on moves that have enough momentum behind them.
Buy Entry Rules
- A green Doji Detector bar appears, showing a Doji style candle and market hesitation.
- A blue arrow from the Trend Predictor confirms upward direction.
- Enter a buy trade at the close of the candle or on a break above the high of the Doji candle.
- Place the stop loss a few pips below the low of the Doji or below the nearest support.
- Take profit at the next resistance or use a reward target of at least 1:1.5 or 1:2.
Sell Entry Rules
- A Doji Detector green bar appears, marking a Doji style candle at a possible turning point.
- A red arrow from the Trend Predictor confirms downward pressure.
- Enter a sell trade at the candle close or on a break below the low of the Doji candle.
- Place the stop loss a few pips above the high of the Doji or above recent resistance.
- Take profit at the next support zone or follow a minimum 1:1.5 or 1:2 reward ratio.
Advantages
- Filters out many false Doji signals because only signals that align with the Trend Predictor are traded.
- Easy to understand for beginners while still reliable for more experienced traders.
- Works well on several intraday timeframes.
- Stop loss placement is straightforward because it is based directly on candle structure.
Drawbacks
- Doji signals in a flat or low volatility market may not lead to strong price movement.
- Trend Predictor arrows can come late during sharp moves and may offer smaller reward potential.
- False signals can occur during news releases when price becomes unstable.
- Requires patience since not every Doji leads to a confirmed Trend Predictor signal.
Case Study 1
On EURUSD M30, price created a Doji candle at a support level and the Doji Detector marked it with a green bar.
One candle later, the Trend Predictor printed a blue arrow.
A buy trade was opened at the candle close with the stop loss just below the Doji low.
Price moved steadily upward and reached the next resistance area, resulting in a gain of about 60 pips.
The setup worked well because the market paused at support, and the Trend Predictor confirmed that buyers were stepping in.
Case Study 2
On GBPJPY H1, price formed a Doji candle near a resistance zone.
The Doji Detector highlighted the candle and shortly after the Trend Predictor printed a red arrow.
A sell trade was opened on the break below the Doji low.
The stop loss was set just above the candle high.
Price turned downward with strong momentum and reached a support area roughly 70 pips lower.
The two indicators lined up perfectly with the structure of the chart and produced a controlled and clean reversal entry.
Strategy Tips
- Wait for both signals to form before entering. Do not trade every Doji on its own.
- Use higher timeframe zones to set realistic take profit targets.
- Avoid trading just before major news because Doji signals often appear in unstable conditions.
- Practice the strategy in a demo account before applying it with real funds.
- Consider using a trailing stop after the trade moves in your favour to protect profits during longer moves.
Download Now
Download the “doji-detector.mq4” Metatrader 4 indicator
FAQ
Why does a Doji appear as a green bar on my chart?
The Doji Detector indicator for MT4 uses a color-coded system to make the pattern stand out from standard price bars.
A green bar indicates that the open and close are nearly identical, meeting the technical criteria for a Doji.
Can I adjust the sensitivity of the Doji detection?
Most versions of this indicator allow you to adjust the “pip” or point difference allowed between the open and close prices.
By tightening this setting, you will only see “perfect” Dojis, while loosening it will show candles that have very small bodies.
Summary
The Doji Detector indicator is an essential utility for price action enthusiasts who want to catch market turning points with greater accuracy.
By highlighting moments of balance between buyers and sellers, it provides a logical starting point for any reversal or continuation strategy.
While it is a powerful tool on its own, its true strength lies in its ability to complement other systems.


