About the Trend Analysis Indicator
The Trend Analysis Indicator for MT4 is designed to evaluate market direction and strength across any currency pair and present the results in a compact, easy-to-read dashboard.
It helps traders focus on directional quality rather than guessing trend conditions.
Instead of showing only bullish or bearish bias, the Indicator categorizes trends into four states: UP strong, UP weak, DOWN strong, and DOWN weak.
This added layer helps traders filter out low-quality setups and concentrate on markets with stronger directional momentum.
In addition to trend assessment, the Indicator displays daily pivot points, key support and resistance levels, and average daily ranges over multiple periods.
This combination supports both directional bias and practical trade planning.
Free Download
Download the “ferrufx-info-indicator.ex4” MT4 indicator
Key Features
- Displays trend direction and strength in a mini dashboard.
- Classifies trends as strong or weak.
- Includes daily pivot points and price levels.
- Shows average daily range data across multiple periods.
- Helps filter out low-momentum markets.
- Suitable for intraday and swing trading.
Indicator Chart
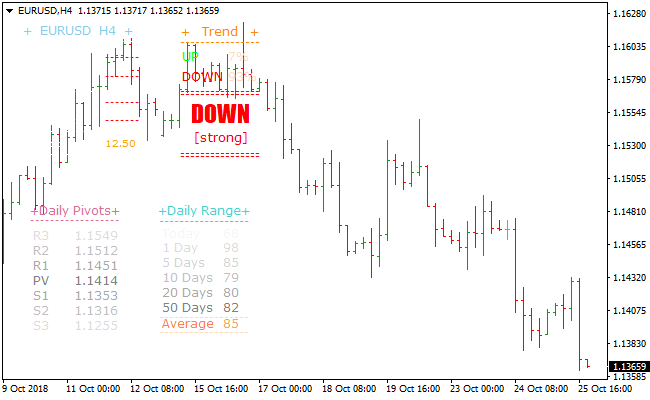
The image below shows the Trend Analysis Indicator displayed as a compact dashboard on the chart.
Trend strength, pivot levels, and range data are presented together, allowing traders to assess conditions at a glance.

Guide to Trade with Trend Analysis Indicator
Buy Rules
- Scan currency pairs for a UP strong trend outcome.
- Confirm price behavior supports bullish continuation.
- Enter a buy trade in the direction of the strong trend.
- Avoid trades when the trend outcome is weak.
Sell Rules
- Scan currency pairs for a DOWN strong trend outcome.
- Confirm price behavior supports bearish continuation.
- Enter a sell trade in the direction of the strong trend.
- Stay out of markets showing weak trend readings.
Stop Loss
- Place the stop loss beyond a recent swing level.
- Use pivot levels as a reference for risk placement.
- Adjust stop distance based on current daily range.
Take Profit
- Use daily pivot resistance or support levels as targets.
- Scale out trades as price approaches key levels.
- Close positions if momentum slows significantly.
- Apply a personal exit method if preferred.
Trend Analysis Indicator + XMaster Formula Forex MT4 Strategy
This MT4 strategy blends the Trend Analysis Metatrader 4 Forex Indicator with the buy/sell signals from the XMaster Formula Metatrader 4 Indicator.
The Trend Analysis indicator identifies the dominant market direction by displaying a strong upward outcome for a buy trend and a strong downward outcome for a sell trend.
The XMaster Formula features precise entry timing, indicated by yellow arrows. A yellow UP arrow is a buy signal, and a yellow DOWN arrow is a sell signal.
This strategy works well on the M15, M30, and H1 time frames. It is suitable for intraday traders and trend followers who want simple confirmation rules.
The method is straightforward and avoids cluttered charts. The trend indicator filters weak setups while the XMaster Formula arrow gives a direct trigger.
Both indicators together create clean and disciplined trading opportunities.
Buy Entry Rules
- The Trend Analysis indicator must display a strong UP signal.
- A yellow UP arrow from the XMaster Formula must appear.
- Enter the buy trade at the next candle after the arrow appears.
- Place the stop loss below the most recent swing low.
- To take profit, target the next resistance level or exit when the Trend Analysis indicator no longer shows a strong UP signal.
Sell Entry Rules
- The Trend Analysis indicator must display a strong DOWN signal.
- A yellow DOWN arrow from the XMaster Formula must appear.
- Enter the sell trade at the next candle after the arrow appears.
- Place the stop loss above the most recent swing high.
- To take profit, target the next support level or exit when the Trend Analysis indicator stops showing a strong DOWN signal.
Advantages
- Clear market direction from the Trend Analysis indicator.
- Precise entry timing from the XMaster Formula arrows.
- Simple rules that traders of all levels can follow.
- Works on many forex pairs and several time frames.
- Helps avoid trades against the dominant trend.
Drawbacks
- May enter slightly late because of the confirmation requirements.
- Range conditions can produce multiple small signals.
- Stop loss distances can vary depending on recent highs or lows.
- Some strong moves may occur without producing an arrow signal.
Case Study 1
On EURUSD M30, the Trend Analysis indicator switched to a strong UP signal after the pair formed a rounded bottom.
A few candles later, a yellow UP arrow appeared from the XMaster Formula.
The entry triggered at the next candle, and the price continued upward in a steady push.
The trade reached the next resistance area where the take profit was set.
This produced a gain of about 48 pips.
The signal worked smoothly because the trend strength was already clear before the arrow confirmation arrived.
Case Study 2
On GBPUSD H1, the Trend Analysis indicator displayed a strong DOWN signal during a strong bearish phase.
A minor pullback developed, and soon after, the XMaster Formula printed a yellow DOWN arrow.
The sell trade was triggered on the next candle, and momentum quickly returned.
The price moved down to the next support level, where the trade was closed for about 72 pips.
Strategy Tips
- Check higher time frames to confirm that the larger trend matches your signal direction.
- Wait for a clean candle close after the arrow signal to avoid premature entries.
- Do not trade when the market is stuck in a tight range with flat swings.
- Consider reducing lot size during volatile market sessions.
- Use round-number price levels as natural support and resistance targets.
- Track the strength of recent swings to identify whether momentum is building or weakening.
Download Now
Download the “ferrufx-info-indicator.ex4” Metatrader 4 indicator
FAQ
What is the difference between strong and weak trends?
Strong trends indicate consistent directional pressure, while weak trends suggest mixed or fading momentum that often leads to choppy price action.
Can this Indicator be used to scan multiple pairs?
Yes. Traders often switch between pairs to quickly identify which markets are currently showing strong directional bias.
How useful is the daily range information?
Daily range data helps traders judge whether a market still has room to move or is nearing typical exhaustion levels.
Is this Indicator better suited for trend trading?
Yes. It is designed to highlight directional strength and is less effective in sideways or low-volatility conditions.
Summary
The Trend Analysis Indicator offers a structured way to identify strong market direction while avoiding weak or uncertain conditions.
Its dashboard layout simplifies complex data into clear trend outcomes.
By combining trend strength with pivot levels and range statistics, it supports disciplined trade selection for both intraday and swing trading strategies.


