About the Gaussian Rainbow MA Indicator
The Gaussian Rainbow MA Indicator for MT4 is a trend-following tool composed of multiple moving averages calculated with different periods.
These moving averages represent short-term, medium-term, and long-term price behavior, forming a layered rainbow-like structure on the chart.
This setup allows traders to judge trend direction, strength, and stability at a glance.
When price trades above the Gaussian Rainbow, bullish conditions dominate the market.
When price trades below the Rainbow, bearish pressure controls direction.
The spacing and alignment of the moving averages help filter out market noise and highlight sustained trends rather than short-lived fluctuations.
The indicator uses a default period setting of 40, which traders can adjust to match their trading style.
It performs well across scalping, day trading, and swing trading environments.
It can be traded on its own or combined with oscillators to refine entries in the direction of the prevailing trend.
Free Download
Download the “gaussian-rainbow.mq4” MT4 indicator
Key Features
- Multiple Gaussian moving averages with varied periods.
- Identifies short-term and long-term trend alignment.
- Helps filter noise during volatile market phases.
- Adjustable period settings for different strategies.
- Works across all MT4 timeframes and currency pairs.
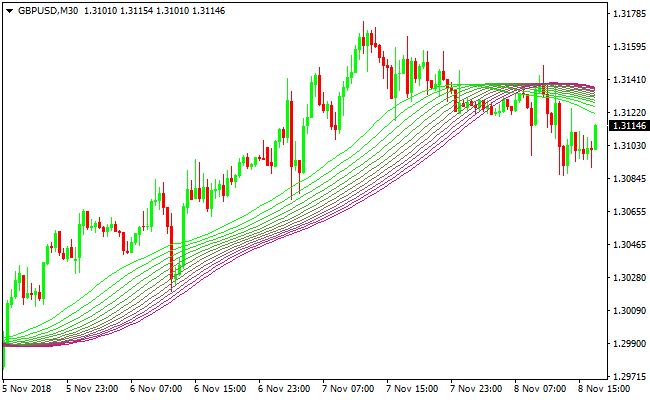
Indicator Chart
The Gaussian Rainbow MA Indicator chart displays a layered group of colored moving averages flowing around price action.
When candlesticks remain above the Rainbow, the chart reflects bullish trend control.
When candlesticks stay below the Rainbow, bearish momentum is in play.

Guide to Trade with the Gaussian Rainbow MA Indicator
Buy Rules
- Confirm that candlesticks are positioned above the Gaussian Rainbow.
- Ensure the Rainbow lines are angled upward.
- Wait for a bullish candle close above the Rainbow structure.
- Enter a buy trade in the direction of the active trend.
Sell Rules
- Confirm that candlesticks are positioned below the Gaussian Rainbow.
- Ensure the Rainbow lines are angled downward.
- Wait for a bearish candle close below the Rainbow structure.
- Enter a sell trade following bearish momentum.
Stop Loss
- Place the stop loss below the lowest purple MA line for buy trades.
- Place the stop loss above the highest purple MA line for sell trades.
- Exit early if price closes fully inside the Rainbow.
Take Profit
- Close all buy orders if price closes below the Gaussian Rainbow.
- Close all sell orders if price closes above the Gaussian Rainbow.
- Alternatively, target the next major support or resistance level.
Gaussian Rainbow + Figurelli Series MT4 Scalping Strategy
This MT4 scalping strategy combines the trend-following clarity of the Gaussian Rainbow MA Indicator with the fast momentum signals of the Figurelli Series Scalper Indicator.
The Gaussian Rainbow provides an easy-to-read trend filter. When candlesticks are above the rainbow, the market is bullish.
When candlesticks are below the rainbow, the market is bearish.
The Figurelli Series Scalper adds short-term entries with a red histogram showing bullish signals above 0 and bearish signals below 0.
This strategy works well on M1, M5, and M15 timeframes and is suitable for intraday scalpers who want clear, trend-aligned signals.
It performs best on highly liquid currency pairs like AUDUSD, USDJPY, or GBPUSD.
Buy Entry Rules
- Candlesticks must be trading above the Gaussian Rainbow, confirming a bullish trend.
- The Figurelli Series histogram is above 0, giving a buy signal.
- Enter a long position at the open of the candle that confirms the histogram signal.
- Place a stop loss a few pips below the Gaussian Rainbow or below the most recent swing low.
- Take profit at 10–25 pips or at the next minor resistance level.
Sell Entry Rules
- Candlesticks must be trading below the Gaussian Rainbow, confirming a bearish trend.
- The Figurelli Series histogram is below 0, giving a sell signal.
- Enter a short position at the open of the candle that confirms the histogram signal.
- Place a stop loss a few pips above the Gaussian Rainbow or above the most recent swing high.
- Take profit at 10–25 pips or at the next minor support level.
Advantages
- Combining trend (Gaussian Rainbow) and momentum (Figurelli Series) increases the probability of successful scalps.
- Simple to read and execute, suitable for fast intraday trades.
- Works well on volatile, liquid pairs for quick profits.
- Flexible enough to scalp on multiple timeframes, including M1, M5, and M15.
Drawbacks
- During low liquidity, trades may hit stop losses quickly due to small spikes.
- Take profit levels must be adjusted carefully, as scalps rely on small pip gains.
Case Study 1: NZDUSD M5
During the early London session, NZDUSD traded above the Gaussian Rainbow, indicating a bullish trend.
The Figurelli Series histogram rose above 0, giving a buy signal.
A long trade was entered at 0.6135 with a stop at 0.6125, risking 10 pips.
Price moved quickly to 0.6150, securing a 15 pip gain before encountering resistance.
Case Study 2: EURJPY M1
EURJPY was below the Gaussian Rainbow in a short-term downtrend during the Tokyo session.
The Figurelli Series histogram dropped below 0, confirming a sell entry.
A short position was taken at 142.80 with a stop at 142.95, risking 15 pips.
Price fell steadily to 142.60, resulting in a 20 pip profit within a few minutes.
Strategy Tips
- Scalp during high volatility periods, such as the London and New York sessions, for better momentum.
- Ensure the Gaussian Rainbow is clearly above or below the candlesticks to avoid choppy conditions.
- Wait for a fresh histogram bar on the Figurelli Series before entering to reduce false signals.
- Combine trades with minor support and resistance levels for safer entries and exits.
- Keep lot sizes small since scalping targets limited pips per trade.
- Consider closing trades early if momentum slows, even before reaching the target pip gain.
Download Now
Download the “gaussian-rainbow.mq4” Metatrader 4 indicator
FAQ
What does the Gaussian Rainbow represent?
It represents multiple layers of market momentum by combining short-term, medium-term, and long-term moving averages into a single trend framework.
Which period setting works best?
The default setting of 40 works well for most markets, though lower values suit scalping while higher values fit swing trading.
Is the indicator suitable for ranging markets?
It performs best in trending conditions and is less effective when price moves sideways through the Rainbow.
Summary
The Gaussian Rainbow MA MT4 Indicator organizes market momentum into a clear multi-layer trend view.
By combining short, medium, and long-term moving averages, it helps currency traders recognize when price is trending cleanly and when momentum begins to weaken.
The indicator adapts well to different trading styles and timeframes, making it practical for both active and position-based traders.
Its ability to keep traders aligned with sustained price direction makes it a dependable tool for trend-following strategies.


