About the Timebox Breakout Indicator
The Timebox Breakout Indicator for MT4 is a daily breakout trading tool that highlights the previous day’s high and low price range directly on the chart.
Drawing a clearly defined box allows traders to identify key breakout levels without manual marking.
This makes it easier to plan trades around daily market expansion.
The indicator focuses on price behavior around the prior day’s range.
A breakout above the daily high signals bullish momentum, while a break below the daily low signals bearish momentum.
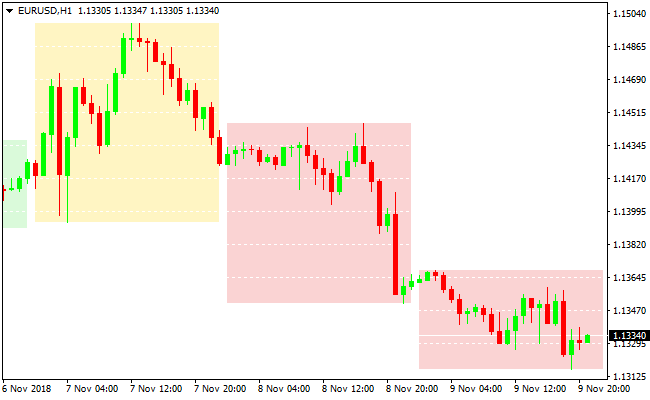
In addition to the price range, the indicator colors the daily box to reflect candle behavior.
Green boxes indicate bullish closes, red boxes show bearish closes, and yellow boxes highlight doji formations that may precede reversals.
Free Download
Download the “gg-timebox-indicator.mq4” MT4 indicator
Key Features
- Automatically draws the previous day’s high and low range.
- Provides clear daily breakout levels.
- Color-coded boxes for quick market context.
- Supports breakout and momentum-based strategies.
- Works on all MT4 timeframes and currency pairs.
Indicator Chart
The Timebox Breakout Indicator chart displays a rectangular box outlining the prior day’s price range.
Traders can see where price breaks above or below the box to signal potential buy or sell opportunities.
The box color reflects daily candle sentiment, helping assess breakout strength.

Guide to Trade with Timebox Breakout Indicator
Buy Rules
- Wait for the price to break above the previous day’s box high.
- Confirm that the breakout candle closes above the box.
- Enter a buy trade in the direction of the breakout.
Sell Rules
- Wait for price to break below the previous day’s box low.
- Confirm that the breakout candle closes below the box.
- Enter a sell trade following the breakout confirmation.
Stop Loss
- Place the stop loss inside the daily box after entry.
- Position the stop near the midpoint of the prior day’s range.
- Reduce position size if the daily range is unusually wide.
Take Profit
- Close all buy orders if price moves back inside the box and drops below its midpoint.
- Close all sell orders once price regains the box midpoint after a breakdown.
- Alternatively, target the next major support or resistance level.
TimeBox Breakout MT4 Scalping Strategy
This scalping strategy combines the breakout structure of the TimeBox Breakout Indicator with the precision entry signals of the Reflex Buy Sell Scalper.
The TimeBox Breakout plots the previous day’s high and low using colored boxes, giving a clear view of whether the prior session was bullish, bearish, or neutral.
When price breaks above the previous high, it suggests a bullish continuation. A break below the previous low suggests bearish continuation.
The Reflex Scalper provides fast buy and sell signals using a blue line for buys and an orange line for sells.
When combined with the TimeBox levels, it creates a structured scalping approach that is suitable for beginners and experienced traders.
This strategy works best on M1, M5, and M15 timeframes.
Buy Entry Rules
- Price must break above the previous day’s high based on the TimeBox Breakout indicator.
- The box color is preferably green, but yellow is also acceptable.
- The Reflex indicator must show a fresh blue line pointing upward.
- Place the stop loss a few pips below the breakout level or below the most recent minor swing.
- Take profit at 10 to 20 pips or at the next intraday resistance level.
Sell Entry Rules
- Price must break below the previous day’s low based on the TimeBox Breakout indicator.
- The box color is preferably red, but yellow is also acceptable.
- The Reflex indicator must show a fresh orange line pointing downward.
- Place the stop loss a few pips above the breakout level or above the latest minor swing high.
- Take profit at 10 to 20 pips or the next support level.
Advantages
- Clear breakout structure makes entries easy to spot.
- Reflex signals add precision and prevent early breakout entries.
- Works well during volatile sessions such as London and New York.
- Good for traders who prefer fast-paced scalping.
Drawbacks
- Breakouts during low volume may fail quickly.
- Requires quick execution, which may be challenging for beginners.
Case Study 1: EURUSD M5
The previous day closed with a green TimeBox, with the high at 1.0890.
During the London session, EURUSD pushed above 1.0890 and broke out strongly.
The Reflex indicator printed a blue line at the same moment, giving the buy confirmation.
The trade moved quickly, reaching +18 pips before stalling near 1.0908.
Closing the trade there secured a clean intraday scalp.
The stop loss stayed safe below the breakout level at 1.0885.
Case Study 2: GBPJPY M15
GBPJPY had a red TimeBox with the previous day’s low at 195.40.
At the New York open, the price broke below 195.40, and the Reflex indicator immediately displayed an orange sell line.
The pair dropped with strong momentum and delivered a solid 28 pip move down to 195.12.
The stop loss above the breakout at 195.48 was never touched, making it a clean sell continuation setup.
Strategy Tips
- Scalp during high liquidity times such as London open and the first two hours of New York.
- Green boxes suggest focusing on buys, and red boxes suggest focusing on sells.
- Avoid trading during major news because breakouts often become fake moves.
- Wait for both the breakout level and the Reflex signal to align before entering.
- Do not chase the breakout if the first candle is already extended; wait for a small pullback.
- Close trades quickly if momentum fades after entry.
Download Now
Download the “gg-timebox-indicator.mq4” Metatrader 4 indicator
FAQ
What market conditions suit the Timebox Breakout Indicator best?
The indicator performs best during active trading sessions where price expansion follows consolidation from the previous day.
Can this indicator be used for scalping?
It can support short-term trades when applied to lower timeframes, though it is primarily designed for structured intraday breakouts.
Summary
The Timebox Breakout MT4 Indicator offers a straightforward way to trade daily price expansion using clearly defined breakout levels.
Marking the prior day’s range and highlighting candle sentiment helps traders prepare structured entries with logical risk placement.
Its simplicity and focus on daily market behavior make it suitable for breakout traders seeking consistency and discipline.


