
About the Average True Range Indicator
The Average True Range (ATR) Indicator for MT4 was developed by J. Welles Wilder. It measures the volatility of any currency pair or trading instrument on the Metatrader 4 platform.
ATR does not indicate trend direction or provide buy/sell signals. Instead, it shows how price volatility changes over time.
The indicator calculates the average of true ranges over a set period, giving traders insight into market movement.
Traders use ATR to set stop losses and take profit levels more effectively.
By understanding volatility, you can adjust your trade size, timing, and risk management strategy.
Free Download
Download the “ATR.mq4” MT4 indicator
Key Features
- Calculates the average price range over a customizable period of time.
- Provides a clear reading of market volatility in points or pips.
- Helps in identifying periods of market consolidation and breakout potential.
- Functions as a dynamic tool for setting volatility-based exit points.
- Adapts to any timeframe from scalping charts to long-term swing trading.
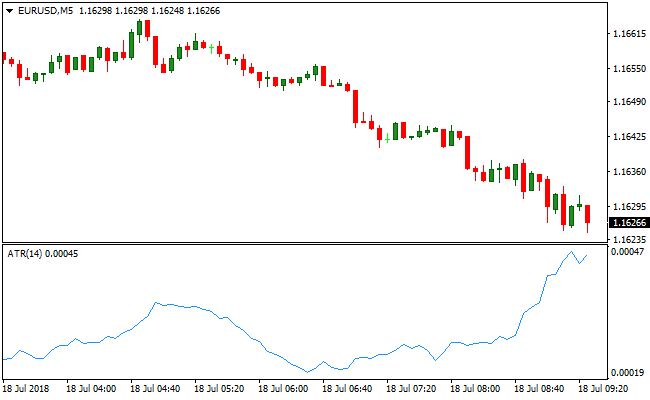
Indicator Chart
The chart displays the Average True Range ATR indicator as a single line in a separate window below the main price action.
This blue line rises when volatility increases and falls when the market enters a period of low activity.
It helps traders identify the best moments to enter or exit based on the current movement range of the asset.
Guide to Trade with Average True Range ATR Indicator
Buy Rules
- Identify a bullish trend or a breakout on the main price chart.
- Check the ATR value to ensure there is enough volatility to reach your target.
- Enter a buy position when price crosses above a key resistance level.
- Confirm that the indicator value is steady or rising to support the move.
Sell Rules
- Locate a bearish trend or a breakdown below a support zone.
- Verify that the ATR is not at an extreme low which might signal a fakeout.
- Open a sell order once price action confirms a downward trajectory.
- Monitor the volatility level to ensure the move has enough momentum.
Stop Loss
- Calculate your stop loss by multiplying the current ATR value by two.
- Place the stop loss below the recent swing low for buy trades.
- Position the stop loss above the recent swing high for sell trades.
- Adjust the distance based on whether the market is highly volatile or calm.
Take Profit
- Set a take profit target at a distance of at least two times the ATR value.
- Align the exit point with the next major psychological or technical level.
- Consider trailing the stop loss as the ATR value changes during the trade.
- Exit the position manually if volatility drops significantly near your target.
ATR and Trend Predictor MT4 Forex Scalping Strategy
This MT4 scalping strategy combines volatility-based risk management with trend signals using the Average True Range Indicator and the Trend Predictor V1.0 Indicator.
The ATR indicator helps calculate dynamic stop loss and take profit levels based on current market volatility, ensuring that trades have enough room to move while minimizing risk.
The Trend Predictor shows blue arrows for buy signals and red arrows for sell signals.
Combining these indicators allows traders to scalp small, high-probability moves while managing risk efficiently across M1 and M5 charts.
Buy Entry Rules
- Wait for a blue arrow to appear on the Trend Predictor, indicating a bullish signal.
- Confirm that the price trend aligns with the signal direction.
- Enter a buy trade at the close of the candle with the blue arrow.
- Set a tight stop loss using the ATR to place it below recent support or a multiple of the ATR value.
- Set take profit using the ATR to target a reasonable move relative to current volatility or exit when a red arrow appears.
Sell Entry Rules
- Wait for a red arrow to appear on the Trend Predictor, indicating a bearish signal.
- Confirm that the price trend aligns with the signal direction.
- Enter a sell trade at the close of the candle with the red arrow.
- Set a tight stop loss using the ATR above recent resistance or a multiple of the ATR value.
- Set take profit using the ATR or exit when a blue arrow appears.
Advantages
- Dynamic stop loss and take profit levels reduce the chance of being stopped out prematurely.
- Trend Predictor provides easy-to-read buy and sell signals.
- Works well on M1 and M5 charts for fast scalping opportunities.
- Combining volatility and trend reduces risk in unpredictable markets.
- Flexible for multiple currency pairs without adjusting settings.
- Helps capture small intraday moves with defined exit rules.
Drawbacks
- Trend Predictor signals may lag slightly in extremely fast-moving markets.
- ATR-based stop losses may need adjustment in highly volatile news events.
- Sideways or low volatility markets can produce multiple false signals.
Example Case Study 1
On EURUSD M1, a blue arrow appeared on the Trend Predictor indicating a buy.
A trade was entered at candle close with an ATR-based stop loss set 3 pips below recent support.
Price moved slowly upward and the trade was closed when a red arrow appeared, capturing a 12 pip scalp.
Using ATR allowed the stop loss to adapt to current volatility and protect the trade.
Example Case Study 2
On GBPJPY M5, a red arrow formed on the Trend Predictor signaling a sell.
A sell trade was entered at candle close with an ATR-based stop above recent resistance.
Price declined steadily, and the trade was closed when a blue arrow appeared, securing a 27 pip profit.
Combining trend direction with ATR-based risk management captured a safe and profitable intraday move.
Strategy Tips
- Adjust ATR multipliers to account for current market volatility on M1 and M5 charts.
- Take partial profits during strong trends to protect gains while letting the rest run.
- Use alerts for Trend Predictor arrows to avoid missing fast scalping opportunities.
- Confirm trade direction with higher timeframe trends for added confidence.
- Scale position sizes according to ATR values to manage risk effectively.
- Combine with support and resistance levels to improve timing and exit strategy.
Download Now
Download the “ATR.mq4” Metatrader 4 indicator
FAQ
How does the ATR period setting affect the signals?
A shorter period like 7 makes the indicator more sensitive to recent price spikes and quick changes in volatility.
A longer period like 14 or 20 provides a much smoother line that reflects the long-term average movement of the market.
Most traders prefer the 14-period setting as it offers a balanced view of daily price ranges.
Can the ATR indicator predict trend reversals?
This indicator does not predict the direction of the market or future price reversals.
It only measures the intensity of price movement.
How do I use the ATR for a trailing stop?
You can use a multiple of the ATR value to trail your stop loss behind the current price.
As the price moves in your favor, you move the stop loss while maintaining a gap equal to the ATR multiplier.
This protects your profits while allowing the trade enough space to fluctuate without being stopped out by noise.
Summary
The Average True Range ATR indicator is a vital asset for any trader who wants to master risk management and volatility analysis.
Its primary benefit is the ability to adapt to any market environment, ensuring that your strategy remains relevant whether the market is trending aggressively or ranging tightly.
While it does not provide buy or sell signals on its own, its integration into a complete trading system improves the consistency of results by aligning stop levels with actual market behavior.


