About the Bollinger Bands Indicator
The Bollinger Bands Indicator for MT4, developed by John Bollinger, measures market volatility using three bands: a middle band and two outer bands.
The bands expand when volatility is high and contract when volatility is low.
This helps traders identify potential entry and exit points based on price movement relative to the bands.
Traders often use the Bollinger Bands to spot overbought and oversold conditions.
For example, in an uptrend, price approaching the lower band can signal a buying opportunity.
In a downtrend, price near the upper band can suggest a selling opportunity.
Free Download
Download the “Bands.mq4” MT4 indicator
Key Features
- Three bands showing volatility and price extremes.
- Helps identify overbought and oversold conditions.
- Expands in high volatility, contracts in low volatility.
- Can be combined with trend or momentum indicators for better signals.
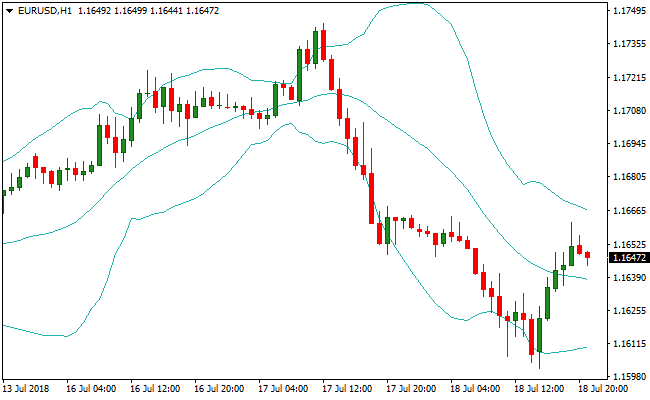
Indicator Chart
The chart displays the Bollinger Bands directly on the price area. The middle band is typically a moving average.
Price reaching the lower band signals potential buy entries, while price approaching the upper band signals potential sell entries.
Traders can visually track volatility and price extremes to improve timing.

Guide to Trade with Bollinger Bands
Buy Rules
- Confirm the overall trend is upward with a trend indicator.
- Wait for the price to reach or touch the lower Bollinger Band.
- Enter a buy trade when momentum confirms a bounce from the band.
- Focus on setups where the lower band coincides with a support area.
Sell Rules
- Confirm the overall trend is downward with a trend indicator.
- Wait for the price to reach or touch the upper Bollinger Band.
- Enter a sell trade when momentum confirms a rejection from the band.
- Focus on setups where the upper band coincides with a resistance area.
Stop Loss
- For buy trades, place the stop below the lower Bollinger band.
- For sell trades, place the stop above the upper Bollinger band.
- Consider trailing the stop as price moves favorably to lock in gains.
Take Profit
- Close buy trades when price reaches the middle or upper Bollinger Band.
- Close sell trades when price reaches the middle or lower Bollinger Band.
- Alternatively, use the opposite band as a dynamic exit target.
Bollinger Bands Indicator and Stealth Oscillator Forex Day Trading Strategy
This MT4 day trading strategy combines trend direction with momentum confirmation using the Bollinger Bands Indicator and the Stealth Oscillator Indicator.
The Bollinger Bands help define the market trend based on the slope of the bands: an upward sloping set of bands indicates a bullish trend and a downward sloping set indicates a bearish trend.
The Stealth Oscillator supplements this by showing a green histogram line for buy signals and a red histogram line for sell signals.
By combining trend and momentum, this strategy filters out weak trades and focuses on strong intraday moves across M15 and H1 charts.
Buy Entry Rules
- Confirm the Bollinger Bands are upward sloping, indicating a bullish trend.
- Wait for the Stealth Oscillator to show a green histogram line.
- Enter a buy trade at the close of the candle where the green histogram line appears.
- Place stop 2–3 pips below the recent swing low or the lower Bollinger Band.
- Take profit at the next key resistance level or when the Stealth Oscillator turns red.
Sell Entry Rules
- Confirm the Bollinger Bands are downward sloping, indicating a bearish trend.
- Wait for the Stealth Oscillator to show a red histogram line.
- Enter a sell trade at the close of the candle where the red histogram line appears.
- Place stop 2–3 pips above the recent swing high or the upper Bollinger Band.
- Take profit at the next key support level or when the Stealth Oscillator turns green.
Advantages
- Bollinger Bands easily reveal trend slope and potential support/resistance levels.
- Stealth Oscillator helps confirm entry timing with green and red histogram signals.
- Works effectively on M15 and H1 charts for clear intraday opportunities.
- Dynamic exits based on momentum shifts help capture larger moves.
- Trend-based filtering reduces the number of low-quality trades.
- Can be paired with price action levels for advanced confirmation.
Drawbacks
- Stealth Oscillator signals can lag slightly during fast reversals.
- Requires active monitoring to catch histogram changes in real time.
- Trade frequency may be limited in low volatility conditions.
Example Case Study 1
On NZDUSD M15, the Bollinger Bands were sloping upward, suggesting a bullish trend.
The Stealth Oscillator turned green, signaling a buy entry.
A buy trade was opened at candle close with a stop placed 3 pips below the recent swing low.
Price continued climbing throughout the session and the position was closed at the next resistance level when the Stealth Oscillator turned red, resulting in a 28 pip gain.
Combining trend slope with momentum helped capture a strong intraday move.
Example Case Study 2
On USDCAD H1, the Bollinger Bands were sloping downward, indicating a bearish trend.
The Stealth Oscillator produced a red histogram line.
A sell trade was entered at the close of the signal candle with a stop set 2 pips above the recent swing resistance high.
Price dropped steadily, and the trade was closed at the next support area when the Stealth Oscillator turned green, capturing a 45 pip profit.
Aligning trend direction and momentum provided a high-probability day trading setup.
Strategy Tips
- Confirm trend direction on a higher timeframe before taking signals on a lower chart.
- Use support and resistance zones to refine entry and exit points for better risk/reward.
- Adjust position size according to volatility and trend strength.
- Be patient and wait for clear momentum confirmation before entering trades.
- Consider exiting partial positions near intermediate levels before full exit.
- Keep a journal to track performance and refine your entry/exit timing.
- Use alerts for histogram color changes to catch moves quickly.
- Remain disciplined and skip signals that do not align with the overall trend.
Download Now
Download the “Bands.mq4” Metatrader 4 indicator
FAQ
How do I use Bollinger Bands during low volatility?
When the bands narrow, it signals a squeeze. Price often breaks out strongly after these tight ranges. Traders watch for a breakout direction.
Can I trade both uptrends and downtrends?
Yes. In uptrends, dips to the lower band can be bought. In downtrends, rallies to the upper band can be sold. Always confirm momentum.
What settings are best for the bands?
The default 20-period SMA with 2 standard deviations works well for most pairs. Adjust based on volatility and timeframe.
Are Bollinger Bands suitable for scalping?
Yes. Short-term traders can use M1, M5, or M15 charts to enter trades on small price swings within the bands.
Summary
The Bollinger Bands Indicator for MT4 measures market volatility and identifies potential overbought and oversold zones.
By tracking price relative to the upper and lower bands, traders can buy dips in uptrends and sell rallies in downtrends.
Narrow bands signal potential breakouts, while wide bands indicate high volatility.
The indicator helps traders time entries and exits with clarity and simplicity.


