
About the TCCI Signals Indicator
The TCCI Signals indicator is a real-time trend analysis tool that delivers straightforward buy and sell signals through a dual-colored signal line.
It continuously evaluates market conditions and updates its color based on bullish or bearish pressure.
When the signal line turns green, the indicator reflects bullish momentum and points toward potential buying opportunities.
When the line switches to red, it signals bearish momentum and highlights possible sell setups.
This color-based approach makes market direction easy to read at a glance.
The TCCI Signals indicator works great as a standalone signal generator or when combined with other technical tools or price action analysis.
It is commonly used by scalpers and day traders who need fast and responsive trend signals during active market sessions.
Free Download
Download the “tcci.ex4” MT4 indicator
Key Features
- Dual-colored signal line that reflects market direction.
- Real-time analysis with instant color changes.
- Clear bullish and bearish signal identification.
- Fully adjustable input parameters.
- Works well across multiple timeframes and currency pairs.
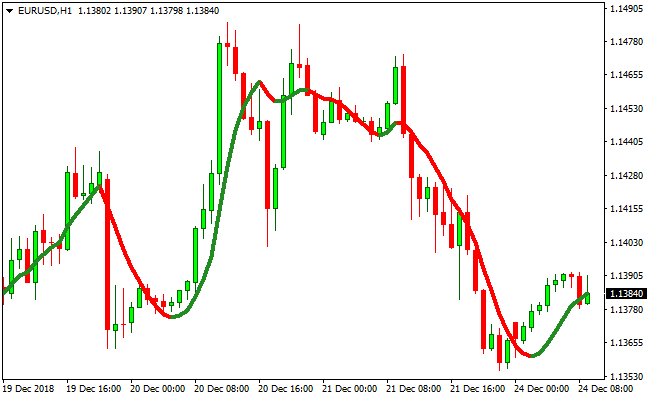
Indicator Chart
The chart displays the TCCI Signals indicator with a color-changing signal line.
Green sections highlight bullish conditions, while red sections indicate bearish momentum and potential sell zones.
Guide to Trade with TCCI Signals Indicator
Buy Rules
- Wait for the TCCI signal line to change from red to green.
- Confirm that price action supports bullish momentum.
- Enter a buy trade at the close of the signal change.
- Focus on trades during active market sessions.
Sell Rules
- Wait for the TCCI signal line to change from green to red.
- Confirm that price action supports bearish momentum.
- Enter a sell trade at the close of the signal change.
- Avoid trades during low-volatility periods.
Stop Loss
- Place the stop loss a few pips beyond the signal line.
- Use nearby intraday structure as a protective buffer.
- Apply a fixed pip stop based on timeframe volatility.
- Reduce risk once the trade moves in your favor.
Take Profit
- Target recent price reaction zones.
- Use a fixed reward multiple based on risk.
- Trail profits while the signal line maintains its color.
- Exit the trade when the signal line changes color.
TCCI Signals and Precision Trend Histogram MT4 Forex Strategy
This strategy combines the TCCI Signals MT4 Indicator with the Precision Trend Buy Sell Histogram MT4 Indicator to identify strong trend-based entries in Forex trading.
The TCCI Signals indicator provides direct buy and sell signals using green and red lines.
The Precision Trend Histogram confirms trend strength with green bars for bullish momentum and red bars for bearish momentum.
This setup works well on multiple time frames, such as H1, H4, and D1.
It is suitable for day traders and swing traders seeking a clear entry and exit framework while managing risk effectively.
Buy Entry Rules
- The TCCI Signals indicator shows a green line, indicating a buy signal.
- Precision Trend Histogram displays green bars, confirming a bullish trend.
- Enter a buy trade at the close of the confirming candle.
- Place a stop loss below the most recent swing low or support level.
- Take profit is set dynamically by exiting a portion of the trade at the next minor resistance level.
- Trail the remaining position using a moving average or previous swing lows for extended profit.
Sell Entry Rules
- The TCCI Signals indicator shows a red line, indicating a sell signal.
- Precision Trend Histogram displays red bars, confirming a bearish trend.
- Enter a sell trade at the close of the confirming candle.
- Place a stop loss above the most recent swing high or resistance level.
- Take profit is set dynamically by closing part of the trade at the next minor support.
- Trail the remaining position using a moving average or previous swing highs.
Advantages
- Combines direct signal and trend confirmation for higher probability trades.
- Flexible on multiple time frames and currency pairs.
- Dynamic take profit allows traders to capture extended trends while locking in partial gains.
Drawbacks
- Signals may be delayed in very volatile markets, causing late entries.
- Trailing take profit requires attention and adjustments based on market behavior.
- Not ideal for scalping on very short time frames.
Case Study 1 – EURUSD
On the EURUSD H1 chart, the TCCI Signals indicator turned green while the Precision Trend Histogram displayed green bars, indicating a buy trade.
The trade was entered at 1.1025 with a stop loss at 1.1000.
Partial profit was taken at 1.1070 near a minor resistance level, and the remaining position was trailed using the previous swing lows, reaching a final exit at 1.1105.
Total profit was 80 pips.
Case Study 2 – AUDUSD
On the AUDUSD H4 chart, the TCCI Signals indicator turned red, and the Precision Trend Histogram showed red bars, signaling a sell trade.
The trade was entered at 0.6760, with a stop loss at 0.6790.
Part of the position was closed at 0.6715, and the remainder was trailed along the previous swing highs, with final exit at 0.6685.
Total profit was 75 pips.
Strategy Tips
- Wait for both the TCCI signal and histogram trend to align before entering a trade.
- Use dynamic take profit to adapt to changing market conditions rather than fixed targets.
- Combine this strategy with higher time frame trend analysis for better context.
- Always manage risk by limiting trades to 1–2% of your account balance.
- Consider skipping trades during major economic news to avoid whipsaws.
- Trail stop losses for extended trends to maximize profits while protecting gains.
Download Now
Download the “tcci.ex4” Metatrader 4 indicator
FAQ
Does the TCCI signal line repaint?
No, the signal line updates in real time based on current market data without altering past signals.
Which trading sessions work best with this indicator?
The indicator works well during the London and New York sessions when volatility and momentum are higher.
Can TCCI be combined with other indicators?
Yes, it pairs well with trend filters, support and resistance, or moving averages.
Is this indicator better for scalping or swing trading?
It works great for scalping and day trading, but higher timeframes can also be used for short-term swing trades.
Summary
The TCCI Signals indicator offers a simple and responsive way to follow market momentum using color-based trend signals.
Its clear visual output makes it easy to identify bullish and bearish conditions without complex interpretation.
By focusing on real-time trend changes, the indicator helps traders time entries more effectively during active market periods.
Its flexibility and adjustable settings make it a practical tool for a wide range of trading styles.


