
About the Trade Channel Fibonacci Indicator
The Trade Channel Fibonacci indicator is a trend-based trading tool that combines price channels with key Fibonacci retracement levels.
It automatically marks the high and low price of a selected period using channel boundaries, helping traders define the active trading range.
Within this channel, the indicator plots Fibonacci retracement levels at 38.2%, 50.0%, and 61.8%.
These levels act as potential pullback zones where price may react before continuing in the direction of the prevailing trend.
By aligning channel direction with Fibonacci retracements, the Trade Channel Fibonacci indicator works well for traders who prefer buying dips in uptrends and selling rallies in downtrends.
It provides a structured approach to trend continuation trading across different currency pairs and timeframes.
Free Download
Download the “trade-channel.mq4” MT4 indicator
Key Features
- Automatically draws a price channel based on recent highs and lows.
- Displays key Fibonacci retracement levels inside the channel.
- Helps identify trend direction using higher highs and lower lows.
- Supports pullback entries within trending markets.
- Works well for intraday and swing trading strategies.
Indicator Chart
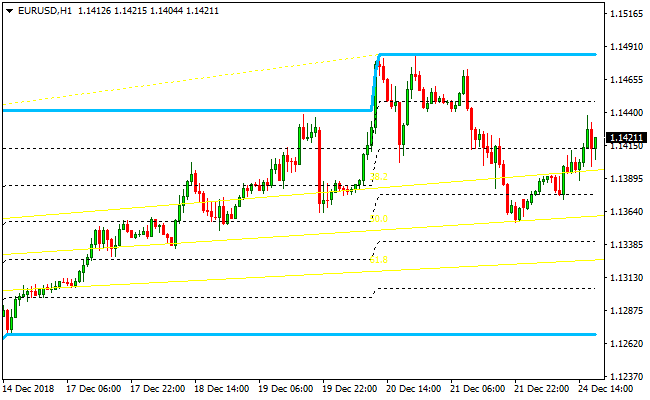
The chart displays the Trade Channel Fibonacci indicator with blue channel boundaries and internal Fibonacci levels.
The setup highlights trend direction and potential buy or sell zones where price retraces toward the Fibonacci levels before resuming its move.
Guide to Trade with Trade Channel Fibonacci Indicator
Buy Rules
- Confirm that the trade channel is forming higher highs and higher lows.
- Wait for price to retrace from the channel high toward the 38.2% Fibonacci level.
- Enter a buy trade when price shows support near the retracement zone.
- Trade only in the direction of the established uptrend.
Sell Rules
- Confirm that the trade channel is forming lower highs and lower lows.
- Wait for price to retrace upward toward the 38.2% Fibonacci level.
- Enter a sell trade when price shows rejection near the retracement zone.
- Trade only in the direction of the established downtrend.
Stop Loss
- Place the stop loss slightly beyond the 50% Fibonacci level.
- Set the stop outside the channel boundary if volatility expands.
- Use a fixed pip stop aligned with recent market volatility.
- Reduce risk once price moves away from the retracement area.
Take Profit
- Target the opposite side of the trade channel.
- Scale out profits near previous channel highs or lows.
- Trail the take profit as long as price respects the channel.
- Close the trade if price fails to resume trend momentum.
Trade Channel Fibonacci and Awesome MT4 Day Trading Strategy
This strategy combines the Trade Channel Fibonacci MT4 Indicator with the Awesome MT4 Indicator to capture intraday trends and high-probability entry points.
The Trade Channel Fibonacci indicator helps identify the trend and key Fibonacci retracement levels, while the Awesome Oscillator confirms momentum and direction.
This setup is ideal for day traders who want to enter trades near retracement levels in the direction of the trend.
The strategy works best on 15-minute, 30-minute, and 1-hour charts.
It can be applied to major Forex pairs like EURUSD, GBPUSD, USDJPY, and AUDUSD, as well as some commodity pairs for more trading opportunities.
It is suitable for traders looking for clear rules, manageable risk, and structured trade setups.
Buy Entry Rules
- Confirm the market is in an uptrend using the Trade Channel Fibonacci indicator: higher highs and higher lows.
- Price approaches the 38.2% Fibonacci retracement level in the uptrend.
- Awesome Oscillator is above 0, confirming bullish momentum.
- Enter a buy trade at or near the 38.2% retracement level once the oscillator confirms the signal.
- Place a stop loss below the most recent swing low within the channel.
- Set take profit at the next swing high or 1.5–2 times the risk.
Sell Entry Rules
- Confirm the market is in a downtrend using the Trade Channel Fibonacci indicator: lower highs and lower lows.
- Price approaches the 38.2% Fibonacci retracement level in the downtrend.
- Awesome Oscillator is below 0, confirming bearish momentum.
- Enter a sell trade at or near the 38.2% retracement level once the oscillator confirms the signal.
- Place a stop loss above the most recent swing high within the channel.
- Set take profit at the next swing low or 1.5–2 times the risk.
Advantages
- Combines trend analysis and momentum confirmation for higher probability entries.
- Provides clear support and resistance levels using Fibonacci retracements.
- Works well on multiple intraday time frames for flexibility.
- Helps traders avoid entering countertrend trades.
Drawbacks
- Retracement levels may not always align perfectly with price, requiring patience.
- Stop loss placement can be tight if swings are small.
- Requires monitoring intraday charts for timely entries and exits.
Case Study 1 – EURUSD
On the EURUSD 30-minute chart, the Trade Channel Fibonacci indicator showed a clear uptrend with higher highs and higher lows.
Price retraced to the 38.2% Fibonacci level near 1.0980.
The Awesome Oscillator was above 0, confirming bullish momentum.
A buy trade was entered at 1.0982, stop loss at 1.0950, and take profit at 1.1050.
The trade captured 68 pips in a single session.
Case Study 2 – GBPUSD
On the GBPUSD 15-minute chart, the Trade Channel Fibonacci indicated a downtrend with lower highs and lower lows.
Price retraced to the 38.2% Fibonacci level near 1.2450.
The Awesome Oscillator was below 0, confirming bearish momentum.
A sell trade was entered at 1.2448, stop loss at 1.2480, and take profit at 1.2380.
The trade captured 68 pips in just a few hours.
Strategy Tips
- Enter trades only when both the Trade Channel Fibonacci and Awesome Oscillator confirm the signal.
- Focus on key Forex pairs that show consistent intraday trends for more reliable setups.
- Wait for the price to approach the 38.2% Fibonacci level before entering to get better risk-to-reward opportunities.
- Consider a higher time frame trend analysis to confirm the overall market direction.
- Adjust stop loss and take profit levels based on current market volatility rather than fixed values.
- Use proper risk management, limiting each trade to 1–2% of your account balance.
Download Now
Download the “trade-channel.mq4” Metatrader 4 indicator
FAQ
Which Fibonacci level is most important for entries?
The 38.2% level is the primary entry zone, as it often aligns with shallow pullbacks in strong trends.
Can this indicator be used in ranging markets?
It performs best in trending conditions. In sideways markets, signals may lose effectiveness.
Does the channel update automatically?
Yes, the channel adjusts as new highs and lows form within the selected calculation period.
Summary
The Trade Channel Fibonacci indicator blends price channels with Fibonacci retracement levels to highlight pullback opportunities within active trends.
Defining both market direction and potential entry zones helps traders stay aligned with price movement rather than chasing breakouts.
Its visual layout makes it easy to track trend strength, retracements, and continuation areas across multiple timeframes.
The indicator works well for traders who prefer buying dips and selling rallies using clearly defined technical levels.


