
About the Trend Continuation Indicator
The Trend Continuation indicator is a trend-following tool designed to identify emerging and continuing market trends.
It operates in a similar way to classic directional movement indicators, but uses a T3 smoothing method to produce more refined signals.
The indicator relies on two key parameters, the T3 period and the T3 continuation factor.
These settings influence how quickly the signal lines react to price movement and how much noise is filtered out.
By adjusting them, traders can fine-tune the balance between responsiveness and smoothness.
The Trend Continuation indicator displays two colored signal lines on the chart.
A change in trend is signaled when these lines cross.
Because of its smooth behavior, the indicator can be used as a standalone tool on higher timeframes or combined with price action and other indicators for scalping and day trading on lower timeframes.
Free Download
Download the “trend-continuation-factor.mq4” MT4 indicator
Key Features
- T3-based trend calculation.
- Two clear signal lines for trend direction.
- Identifies trend continuation and reversals.
- Adjustable T3 period and continuation factor.
- Suitable for higher and lower timeframes.
- Works well with other technical tools.
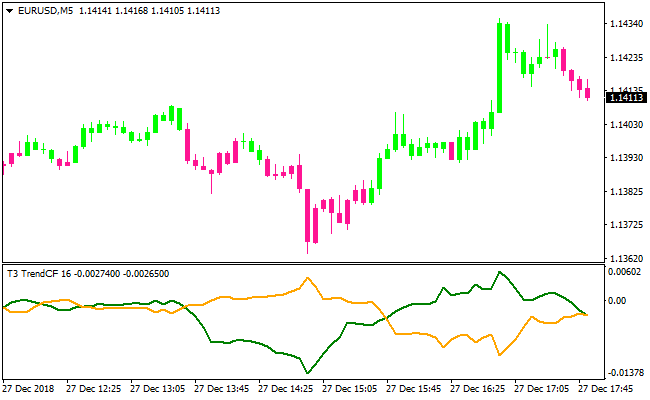
Indicator Chart
The Trend Continuation indicator chart shows two smooth signal lines plotted directly in a sub-chart.
The green line represents bullish pressure, while the orange line reflects bearish pressure.
Crossovers between these lines highlight potential trend changes and continuation points, making trend direction easy to spot.
Guide to Trade with Trend Continuation Indicator
Buy Rules
- Wait for the green signal line to cross above the orange line.
- Confirm the crossover occurs after a pullback or consolidation.
- Check that price action supports bullish continuation.
- Open a buy trade after the crossover is confirmed.
Sell Rules
- Wait for the orange signal line to cross above the green line.
- Ensure the crossover aligns with bearish price behavior.
- Avoid entries during flat or low-volatility conditions.
- Open a sell trade after the crossover is confirmed.
Stop Loss
- Place the stop beyond a recent consolidation range.
- Allow room based on current market volatility.
- Keep the stop outside short-term price spikes.
- Reduce risk if the signal lines flatten after entry.
Take Profit
- Target extended price moves in the direction of the trend.
- Trail profits as long as the signal lines remain separated.
- Secure partial gains during strong impulsive moves.
- Exit trades when the signal lines cross back.
MT4 Trend Continuation + NRTR Trend Following Forex Strategy
This strategy combines the Trend Continuation MT4 Forex Indicator with the NRTR Trend Following MT4 Indicator.
The Trend Continuation indicator signals buy entries when the green line crosses above the orange line and sell entries when the orange line crosses above the green line.
The NRTR indicator confirms trend direction: the blue dotted line below the candlesticks indicates a buy trend, the red line above indicates a sell trend.
By combining these indicators, traders can scalp or trade short-term trends while filtering false signals using the trend confirmation.
This strategy works well on M5 and M15 charts and is suitable for traders looking for intraday trend-following opportunities.
Buy Entry Rules
- NRTR dotted line must be blue, confirming an uptrend.
- Trend Continuation green line crosses above the orange line from below, signaling a buy.
- Enter long at the open of the next candle after the crossover appears and NRTR confirms the trend.
- Place a stop loss a few pips below the recent swing low or support area.
- Take profit at 1.5 to 2 times the stop-loss distance, or exit if NRTR turns red or the Trend Continuation lines signal a sell.
Sell Entry Rules
- NRTR line must be red, confirming a downtrend.
- Trend Continuation orange line crosses above the green line from below, signaling a sell.
- Enter short at the open of the next candle after the crossover appears and NRTR confirms the trend.
- Place a stop loss a few pips above the recent swing high or resistance area.
- Take profit at 1.5 to 2 times the stop-loss distance, or exit if NRTR turns blue or the Trend Continuation lines signal a buy.
Advantages
- Combines trend continuation signals with trend confirmation, increasing the accuracy of entries.
- Works on multiple timeframes, making it flexible for different trading styles.
- Suitable for multiple currency pairs with strong trending behavior.
- Helps avoid countertrend trades by ensuring trades align with the current trend.
- It can be used for both scalping and short-term intraday trading.
Drawbacks
- In sideways or choppy markets, Trend Continuation signals may generate false entries.
- Frequent small trades may lead to higher transaction costs and spreads, impacting profitability.
- The strategy relies heavily on indicator alignment; delayed signals can reduce effectiveness.
- May underperform during low volatility sessions or flat markets.
Case Study 1
On EURUSD M5 during the London session, the NRTR dotted line was blue, signaling an uptrend.
The Trend Continuation green line crossed above the orange line, triggering a buy entry.
The trader entered at the next candle, placing a stop loss 6 pips below the recent swing low and a take profit 12 pips above.
Price moved steadily upward and hit the take profit within 15 minutes.
Both indicators remained aligned throughout the trade, resulting in a successful scalp.
Case Study 2
On AUDUSD M15 during the New York session, the NRTR line turned red, indicating a downtrend.
The Trend Continuation orange line crossed above the green line from below, signaling a sell.
The trader entered short at the next candle, placing a stop loss 10 pips above the recent swing high and a take profit 20 pips below.
Price dropped consistently for over 25 minutes and reached the take profit target.
Indicator alignment confirmed the trend and validated the trade.
Strategy Tips
- Wait for both indicators to align before entering to avoid false signals.
- Use higher timeframe charts to verify the overall trend direction before entering trades on lower timeframes.
- Combine with support and resistance levels to filter entries and improve risk/reward ratio.
- Keep position sizes small when scalping or trading short-term to reduce exposure to volatility spikes.
- Backtest the strategy on multiple pairs and sessions to determine which setups produce the highest probability trades.
Download Now
Download the “trend-continuation-factor.mq4” Metatrader 4 indicator
FAQ
What makes this indicator different from standard trend tools?
The use of T3 smoothing helps reduce lag while keeping signals clean, making crossovers more reliable during trending phases.
Is the Trend Continuation indicator better for higher timeframes?
It performs very well on higher timeframes as a standalone tool, but it can also be adapted for lower timeframes with proper confirmation.
Can the T3 settings be optimized?
Yes. Traders are encouraged to experiment with the T3 period and continuation factor to match their preferred trading style and market conditions.
Summary
The Trend Continuation indicator provides a smooth and reliable way to track market trends using T3-based signal line crossovers.
Its visual simplicity makes trend changes easy to interpret.
With adjustable parameters, compatibility across timeframes, and strong performance in trending markets, this indicator is a solid option for traders focused on trend-following strategies.


