About the RSI Triple Stochastic Signals Indicator
The RSI Triple Stochastic Signals indicator is a momentum-based trading tool built from a combination of RSI and a triple Stochastic calculation.
It is designed to deliver clear buy and sell signals while filtering out low-quality market noise.
The indicator oscillates between two extreme values, 28 and -28.
Between these levels lies a gray no-trade zone that helps reduce false signals during sideways or weak market conditions.
Signals only appear when momentum is strong enough to break out of this filtered area.
A blue bar printed above the gray zone signals bullish momentum, while a red bar below the zone signals bearish pressure.
The RSI Triple Stochastic Signals indicator can be used for scalping, day trading, and swing trading, and all parameters can be adjusted from the inputs menu to suit different trading styles.
Free Download
Download the “RSI HistoTripleStoch.mq4” MT4 indicator
Key Features
- Combines RSI with triple Stochastic calculations.
- Filtered gray no-trade zone to reduce false signals.
- Blue and red bars for clear trade direction.
- Works for scalping, day trading, and swing trading.
- Fully adjustable indicator parameters.
- Performs well during active market sessions.
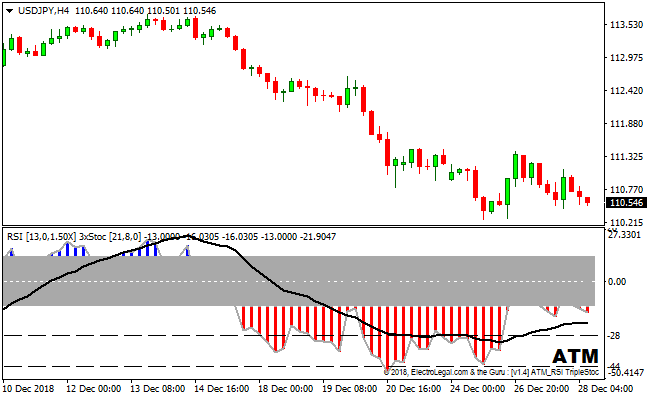
Indicator Chart
The RSI Triple Stochastic Signals indicator chart displays a histogram that moves above and below a central gray zone.
Blue bars above the zone indicate bullish momentum, while red bars below indicate bearish momentum.
This visual layout allows traders to quickly spot momentum shifts and act on strong directional moves.

Guide to Trade with RSI Triple Stochastic Signals Indicator
Buy Rules
- Wait for the first blue bar to appear above the gray no-trade zone.
- Confirm that momentum is expanding rather than fading.
- Check market conditions for sufficient volatility.
- Open a buy trade after the signal bar is confirmed.
Sell Rules
- Wait for the first red bar to appear below the gray no-trade zone.
- Ensure bearish momentum is clearly building.
- Avoid selling during low-volume periods.
- Open a sell trade after the signal bar is confirmed.
Stop Loss
- Place the stop beyond a nearby consolidation zone.
- Use recent volatility to define a realistic stop distance.
- Keep the stop outside short-term price noise.
- Reduce risk exposure if momentum weakens quickly.
Take Profit
- Target previous price reaction areas.
- Scale out profits as momentum slows.
- Use session highs or lows as reference points.
- Exit fully if the histogram returns to the gray zone.
MT4 RSI‑Triple Stochastic Signals + SuperTrend Scalping Strategy
This strategy uses the RSI Triple Stochastic Signals MT4 Indicator along with the Non‑Repainting SuperTrend MT4 Indicator.
The stochastic / RSI‑based indicator gives a clear “buy” when a blue bar appears above the no‑trade zone and a “sell” when a red bar appears below.
The SuperTrend acts as a trend filter using a color-coded dotted line: when the line is blue, it indicates a bullish trend, when red, it indicates a bearish trend.
By combining momentum (via the stochastic/RSI) with trend direction (SuperTrend), the strategy aims to catch high‑probability scalping setups on short timeframes such as M1 and M5.
Buy Entry Rules
- SuperTrend dotted line must be blue, signaling an uptrend.
- The RSI‑Triple Stochastic indicator must show a blue bar (above the no‑trade zone), signaling bullish momentum.
- Enter long at the open of the next candle after the blue bar appears while SuperTrend remains blue.
- Place a stop loss a few pips below the most recent swing low or below a nearby support zone.
- Set take profit at 1.5 to 2 times the stop‑loss distance, or exit when either the SuperTrend line turns red, or the stochastic indicator flips to a red bar (sell signal).
Sell Entry Rules
- SuperTrend dotted line must be red, indicating a downtrend.
- The RSI‑Triple Stochastic indicator must show a red bar (below the no‑trade zone), signaling bearish momentum.
- Enter short at the open of the next candle after the red bar appears while SuperTrend stays red.
- Place a stop loss a few pips above the most recent swing high or above a nearby resistance zone.
- Set take profit at 1.5 to 2 times the stop‑loss distance, or exit when SuperTrend turns blue, or the stochastic indicator shows a blue bar (buy signal).
Advantages
- The combination of momentum and trend helps filter out weak or false signals, increasing the probability of success.
- Works well on small timeframes (M1, M5), ideal for scalpers who want many trade opportunities per session.
- Defined stop‑loss and take‑profit rules help keep risk under control and support consistent trade management.
- Because SuperTrend adjusts for volatility via ATR, the strategy adapts to changing market conditions rather than relying on static thresholds.
- Combining a trend filter with a momentum signal reduces the chance of entering counter‑trend trades or signals during market noise.
Drawbacks
- Because timeframes are short, small spikes or spread‑related noise may trigger stop loss before the move develops fully.
- The strategy depends heavily on indicator alignment; when one indicator lags, signals may come too late or at sub‑optimal prices, reducing profit potential.
Case Study 1
On EURUSD M1 during a London session, the SuperTrend line was blue, indicating a bullish trend.
The RSI‑Triple Stochastic indicator showed a blue bar above the no‑trade zone right after a minor pullback.
The trader entered long at the next candle with a stop loss 6 pips below the recent swing low.
Price then surged steadily and reached a 12‑pip take profit within 10 minutes.
SuperTrend remained blue and stochastic stayed bullish for the duration of the move, resulting in a clean scalp.
Case Study 2
On GBPUSD M5 during early New York hours, the SuperTrend dotted line turned red after a retracement, signaling a bearish trend.
The stochastic indicator then formed a red bar below the no‑trade zone.
The trader entered short at the next candle with a stop loss 8 pips above the recent swing high and a take profit 16 pips below.
Over the next 18 minutes, the price dropped sharply and hit the take profit.
The SuperTrend stayed red, and the momentum remained bearish, validating the trade.
Other Strategy Tips
- Focus on major and liquid currency pairs such as EURUSD, GBPUSD, USDJPY, or AUDUSD to reduce spreads and slippage.
- Avoid trading in flat or consolidating markets; wait for a clear trend and proper alignment of signals before entering.
- Check higher timeframe charts (H1 or H4) to confirm overall market direction and avoid trading against the longer-term trend.
- Combine entries with nearby support and resistance levels to improve risk/reward and reduce the chance of whipsaws.
- Use smaller position sizes due to the frequent trades and fast moves in scalping to manage risk effectively.
- Test the strategy on a demo account across multiple pairs and sessions to understand performance and identify the best setups.
Download Now
Download the “RSI HistoTripleStoch.mq4” Metatrader 4 indicator
FAQ
What is the purpose of the gray no-trade zone?
The gray zone filters out weak momentum and ranging conditions. Signals outside this zone are more likely to reflect meaningful price movement.
Can this indicator be used during all trading sessions?
Yes, but it performs best during high-liquidity sessions such as London and New York, especially for scalping and day trading.
Can I change the sensitivity of the signals?
Yes. All indicator parameters can be adjusted from the inputs menu, allowing traders to fine-tune responsiveness and filtering.
Summary
The RSI Triple Stochastic Signals indicator delivers momentum-based buy and sell signals with built-in filtering to reduce false entries.
Its histogram-style display makes signal interpretation fast and intuitive.
With flexible settings, session-friendly performance, and suitability across multiple trading styles, this indicator is a solid choice for traders who rely on momentum confirmation rather than raw price movement.


