About the TSI MACD Indicator
The TSI MACD MetaTrader 4 indicator is a hybrid momentum tool that combines the True Strength Index with the Moving Average Convergence Divergence.
By merging these two momentum-based calculations, the indicator provides deeper insight into both trend direction and the strength behind price movement.
It is designed to help traders identify when momentum supports a bullish or bearish market phase.
The indicator oscillates within a fixed range between -110 and +110.
A zero baseline sits at the center and acts as the main bias level.
Moves above this level reflect bullish momentum, while moves below it indicate bearish pressure.
This makes it easier to distinguish trending conditions from weak or indecisive phases.
Unlike traditional oscillators that focus only on extremes, the TSI MACD emphasizes sustained momentum.
This allows traders to stay aligned with dominant price movements rather than reacting to short-lived fluctuations.
Free Download
Download the “tsi-macd.ex4” Metatrader 4 indicator
Key Features
- Combines True Strength Index and MACD logic.
- Momentum-based oscillator with a defined range.
- Zero baseline used to define market bias.
- Displays trend direction and momentum strength.
- Clear line interactions for entry and exit timing.
Indicator Chart
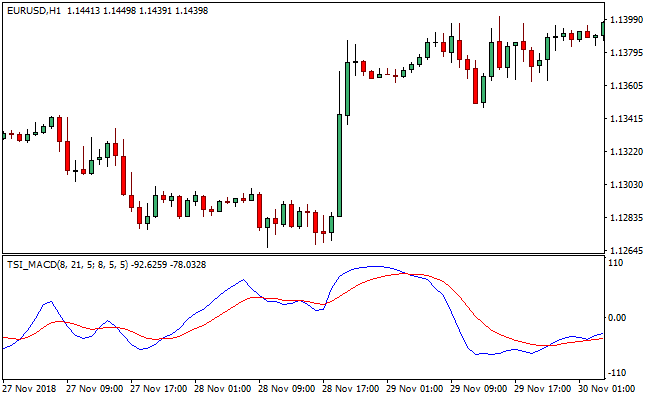
The chart below shows the TSI MACD indicator plotted in a separate window beneath the price chart.
The blue and red lines oscillate around the zero baseline, highlighting momentum shifts.
Crosses above and below this level help traders identify changes in market bias.

Guide to Trade with the TSI MACD Indicator
Buy Rules
- Wait for the blue TSI MACD line to cross above the zero baseline.
- Confirm momentum is expanding upward.
- Ensure the indicator remains above the zero level.
- Enter a buy trade after the crossover candle closes.
Sell Rules
- Wait for the blue TSI MACD line to cross below the zero baseline.
- Confirm momentum is expanding downward.
- Ensure the indicator remains below the zero level.
- Enter a sell trade after the crossover candle closes.
Stop Loss
- Place the stop beyond the most recent swing point.
- Keep the stop outside nearby consolidation zones.
- Avoid placing stops directly on the zero baseline.
- Adjust the stop as price continues in the trade direction.
Take Profit
- Target previous highs or lows in the trend direction.
- Hold the position while momentum remains supportive.
- Scale out if the indicator starts to flatten.
- Exit when the red line crosses the zero baseline.
TSI-MACD + Afirma Trend Forex Strategy for MT4
This strategy blends the momentum strength of the TSI MACD MT4 Forex Indicator with the trend filter from the Afirma Forex Trend Indicator MT4.
The TSI MACD gives entries when its blue line crosses the zero baseline, a simple and effective momentum signal.
The Afirma Trend Indicator tracks the broader trend: the blue line means a bullish trend, the red line means a bearish trend.
By combining them, you only take momentum entries that align with the overall trend direction.
This reduces noise and improves the chances for clean entries.
The method works best on M5 and M15 charts and is suited for traders looking for medium-term trades within the day.
Buy Entry Rules
- The Afirma Trend line must be blue, indicating a bullish trend.
- The blue line of the TSI MACD must cross upward over the zero baseline (from negative/near-zero into positive territory).
- Enter long at the open of the next candle after the cross.
- Place a stop loss a few pips below the recent swing low or below a recent support area.
- Set take profit at a 1:2 risk-to-reward ratio, or exit when the Afirma Trend line turns red or when the TSI MACD blue line crosses back below zero.
Sell Entry Rules
- The Afirma Trend line must be red, indicating a bearish trend.
- The blue line of the TSI MACD must cross downward below the zero baseline (from positive/near-zero into negative territory).
- Enter short at the open of the next candle after the cross.
- Place a stop loss a few pips above the recent swing high or above a recent resistance area.
- Set take profit at a 1:2 risk-to-reward ratio, or exit when the Afirma Trend line turns blue, or the TSI MACD blue line crosses back above zero.
Advantages
- Combines trend filter with momentum entries to improve trade quality.
- Simple, objective entry and exit rules which are easy to follow and test.
- Suitable for multiple currency pairs on M5 and M15 charts.
- Risk-to-reward ratio makes risk control manageable.
- Works well in trending markets and during active trading sessions.
Drawbacks
- Late entries are possible if the zero-line cross happens after a strong move already started.
- Stop loss may be hit during sudden reversals or spikes, especially on lower-liquidity pairs.
- Small-to-medium pip targets require consistent accuracy to be profitable over time.
Case Study 1
On GBPUSD M15 during London–New York overlap, Afirma Trend line was blue.
The blue line of the TSI MACD crossed above zero.
The trader entered long at the next candle. Stop loss was placed 12 pips below the recent swing low.
Price rallied over the next 45 minutes, and the trade reached a 24-pip take profit (1:2 risk-reward).
The Afirma Trend stayed bullish, and TSI MACD remained positive throughout the move.
Case Study 2
On USDJPY M5 during the Asian session, the Afirma Trend line turned red.
Shortly after, the blue TSI MACD line crossed below zero.
The trader entered short at the next candle, with a stop loss 10 pips above the recent swing high.
The pair dropped quickly, and after 25 minutes the trade hit a 20-pip profit target (1:2 risk-reward).
The Afirma Trend stayed bearish, and TSI MACD remained negative until exit.
Strategy Tips
- Use this strategy on liquid pairs like EURUSD, GBPUSD, USDJPY, and GBPJPY to minimise spread and slippage.
- Prefer trading during active sessions when volatility is higher to get better momentum signals.
- If the trend line changes before the take profit, consider tightening the stop loss or exiting early to protect gains.
- Backtest the strategy on several pairs and timeframes to find which suits your trading style best.
Download Now
Download the “tsi-macd.ex4” Metatrader 4 indicator
FAQ
What is the main purpose of the TSI MACD indicator?
The indicator is designed to evaluate trend direction while also measuring momentum strength.
This combination helps traders avoid weak or fading market moves.
How is TSI MACD different from standard MACD?
TSI MACD integrates True Strength Index calculations.
This adds an extra momentum layer and improves sensitivity to sustained price movement.
Summary
The TSI MACD MT4 indicator delivers a refined view of market momentum by combining two established technical tools.
Its zero baseline and oscillating range make it easier to determine directional bias and strength.
By focusing on momentum confirmation rather than isolated signals, the indicator helps traders stay aligned with meaningful trends.
Its clarity and dual-indicator logic make it a valuable addition to momentum-focused trading strategies.


