About the Volatility Bars Indicator
The Volatility Bars indicator is designed to help traders understand current market conditions by measuring changes in volatility.
Knowing whether the market is active or quiet allows traders to select strategies that fit the environment rather than forcing trades during unfavorable conditions.
The indicator is displayed in a separate window as blue histogram bars that rise and fall based on volatility levels.
Expanding bars suggest increased market activity, while shrinking bars signal calmer trading conditions.
This information is valuable for timing entries and avoiding periods where price movement lacks follow-through.
Volatility Bars does not attempt to predict direction.
Its role is to provide context, helping traders decide when momentum-based or mean-reversion strategies are more appropriate.
It is commonly paired with oscillators or price-based tools to form complete trade setups.
It is especially useful for intraday traders who need to adjust quickly to changing market behavior.
Free Download
Download the “volatility-indicator-2.ex4” MT4 indicator
Key Features
- Measures market volatility rather than price direction.
- Displayed as blue histogram bars in a separate window.
- Highlights active versus quiet market sessions.
- Helps traders adapt strategy selection.
Indicator Chart
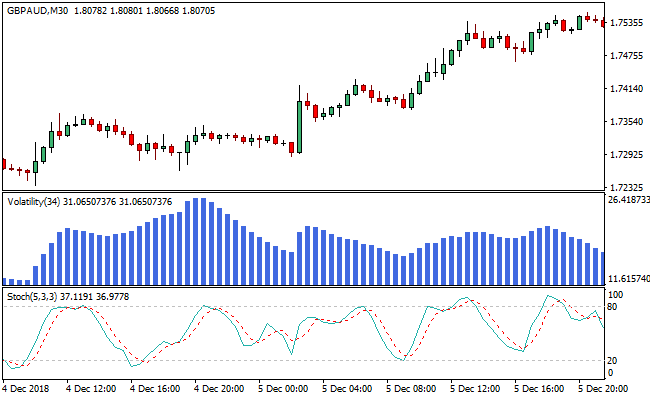
The Volatility Bars indicator appears in a separate window below the price chart.
The chart shows blue histogram bars expanding during volatile sessions and contracting during quiet periods.
These changes help traders judge whether the market is suitable for active trading setups.

Guide to Trade with the Volatility Bars Indicator
Buy Rules
- Identify a market pullback near a recent price low.
- Confirm that Volatility Bars are expanding into the upper range.
- Wait for an oscillator to signal oversold conditions.
- Enter a buy trade as volatility supports price expansion.
Sell Rules
- Identify price rejection near a recent high.
- Confirm that Volatility Bars are expanding into the upper range.
- Wait for an oscillator to signal overbought conditions.
- Enter a sell trade as volatility supports downside movement.
Stop Loss Rules
- Place the stop loss beyond the most recent swing level.
- Allow extra room when volatility readings are elevated.
- Exit early if volatility collapses unexpectedly.
Take Profit Rules
- Target nearby support or resistance levels.
- Scale out as volatility begins to contract.
- Close the trade when momentum slows significantly.
MT4 Volatility Bars + Tipu CCI Forex Day Trading Strategy
This strategy combines the Volatility Bars MT4 Indicator with the Tipu CCI MT4 Indicator.
The Volatility Bars help identify potential reversal points by highlighting when the price has reached the bottom or top, with histogram bars scanning the upper-end regions for buy or sell opportunities.
The Tipu CCI displays a histogram: blue bars above zero indicate a bullish trend, while red bars below zero indicate a bearish trend.
Combining price volatility with trend direction increases the probability of profitable day trades.
This approach is best applied to intraday charts such as M15, M30, or H1.
It is suitable for traders seeking high-probability entries aligned with both market momentum and trend direction.
By waiting for confirmation from stochastic crossings and trend direction, it filters out false signals and reduces the risk of entering trades during choppy markets.
Buy Entry Rules
- Price must have reached a short-term bottom, and Volatility Bar histograms should indicate scanning for buying opportunities.
- The Stochastic indicator must enter the oversold region, and the %K line must cross above the %D line.
- The Tipu CCI histogram must be blue, confirming bullish trend direction.
- Enter a long position at the close of the candle when all conditions align.
- Place a stop loss below the recent swing low of the timeframe used.
- Take profit when either:
- The stochastic %K line crosses below the %D line in overbought territory, or
- The Tipu CCI histogram turns red, signaling a weakening trend.
Sell Entry Rules
- Price must have touched a short-term high, and Volatility Bar histograms indicate scanning for selling opportunities.
- The Stochastic indicator must enter the overbought region, and the %K line must cross below the %D line.
- The Tipu CCI histogram must be red, confirming bearish trend direction.
- Enter a short position at the close of the candle when all conditions align.
- Place a stop loss above the recent swing high of the timeframe used.
- Take profit when either:
- The stochastic %K line crosses above the %D line in oversold territory, or
- The Tipu CCI histogram turns blue, signaling a weakening trend.
Advantages
- Combines price volatility with trend confirmation for more accurate entries.
- Filters trades using stochastic oversold/overbought conditions to catch momentum shifts.
- Provides clear exit signals based on trend reversal or stochastic crossovers.
- Works well on multiple intraday timeframes for frequent trading opportunities.
- Helps avoid entering trades during choppy market conditions by requiring the alignment of multiple indicators.
Drawbacks
- Requires monitoring both stochastic and Tipu CCI, which can be challenging for rapid price movements.
- In highly trending markets, stochastic signals may produce false retracement entries.
- Trading multiple conditions increases the potential to miss trades if signals do not align quickly.
- May require some adjustment for different currency pairs to optimize sensitivity.
Example Case Study 1
On the EUR/GBP M15 chart during the London session, the price reached a short-term bottom while Volatility Bars indicated scanning for buy opportunities.
The stochastic %K line crossed above %D in the oversold region, and the Tipu CCI histogram was blue.
A long position was entered at the close of that candle with a stop loss below the recent swing low.
Price moved upward over the next few candles, and the stochastic %K crossed below %D in overbought territory, triggering take profit and closing the trade successfully.
Example Case Study 2
On the USD/JPY H1 chart during New York hours, price touched a short-term high, Volatility Bars indicated a sell opportunity, and the stochastic %K crossed below %D in the overbought region.
The Tipu CCI histogram was red, confirming a bearish trend.
A short position was opened at the close of the candle with a stop loss above the recent swing high.
Price declined over the next hour, and the Tipu CCI histogram turned blue, signaling a weakening trend and triggering the exit.
The trade captured a strong intraday move with minimal retracement.
Strategy Tips
- Focus on active trading sessions like London and New York for clearer volatility patterns and trend alignment.
- Avoid trading during low liquidity periods, as stochastic signals may produce false entries.
- Consider adjusting stop loss distance based on the volatility of the currency pair being traded.
- Use a trade journal to track which pairs respond best to this strategy for consistent results.
- Combining this strategy with support and resistance levels can increase the probability of successful trades.
Download Now
Download the “volatility-indicator-2.ex4” Metatrader 4 indicator
FAQ
Does the Volatility Bars indicator show trade direction?
No, the indicator measures market activity levels only.
Direction must be determined using price action or complementary indicators.
Why is this indicator paired with oscillators?
Oscillators help identify entry timing, while Volatility Bars confirm whether market conditions support meaningful price movement.
Can this indicator be used on higher timeframes?
Yes, it works on all timeframes, though its impact is most noticeable on intraday charts.
Is the indicator suitable for standalone trading?
No, it is best used as a market condition filter within a broader trading setup.
Summary
The Volatility Bars indicator helps traders adjust their approach based on current market activity.
Highlighting when volatility is rising or fading provides valuable context for strategy selection.
Used alongside timing tools such as oscillators or price-based signals, the indicator supports more informed trading decisions.
It is a practical addition for traders who want to trade active markets while avoiding unproductive conditions.


