
About the VQ Candlestick Bars Indicator
The VQ Candlestick Bars indicator is a trend-following tool built on moving average calculations.
Its primary purpose is to help traders identify the current market direction while also highlighting potential trend changes as they develop.
Unlike traditional indicators that are plotted in a separate window, the VQ Candlestick Bars indicator is displayed directly on the price chart.
It overlays colored bars on top of the existing candlesticks, making trend assessment fast and intuitive.
Green bars indicate bullish market conditions, while red bars signal bearish pressure.
As long as the bar color remains unchanged, the indicator suggests that the prevailing trend is intact.
A color shift often signals that momentum is changing.
Free Download
Download the “vq-bars.ex4” MT4 indicator
Key Features
- Built using moving average logic to follow market direction.
- Overlays colored bars directly on the price chart.
- Green bars highlight bullish market phases.
- Red bars highlight bearish market phases.
- Works across all timeframes and currency pairs.
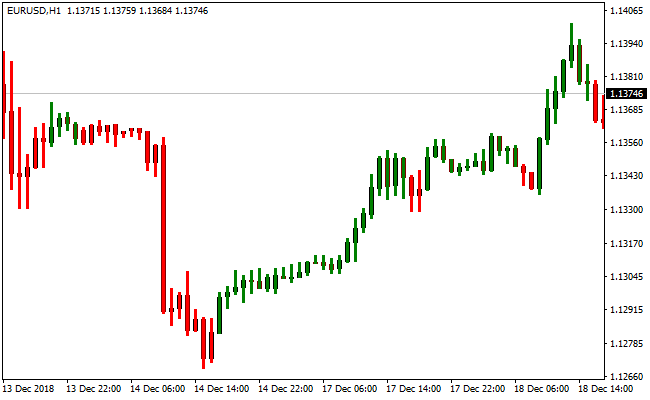
Indicator Chart
The VQ Candlestick Bars indicator is plotted directly over the price candlesticks.
The chart shows green and red bars layered on top of standard candles.
These bars reflect trend direction and make it easier to remain aligned with ongoing market momentum.
Guide to Trade with the VQ Candlestick Bars Indicator
Buy Rules
- Wait for the VQ indicator to display green bars.
- Confirm that green bars continue to form consecutively.
- Ensure price is not reacting strongly from nearby resistance.
- Favor buy trades during sustained upward price movement.
Sell Rules
- Wait for the VQ indicator to display red bars.
- Confirm that red bars remain consistent across candles.
- Ensure price is not reacting strongly from nearby support.
- Favor sell trades during sustained downward price movement.
Stop Loss Rules
- Place the stop loss beyond the most recent swing point.
- Use a tighter stop when trading lower timeframes.
- Exit the trade if the bar color flips against the position.
Take Profit Rules
- Target recent highs or lows based on trade direction.
- Trail profits while bar color remains unchanged.
- Close the trade when momentum visibly weakens.
MT4 VQ Candlestick Bars + Zero Lag MA Forex Day Trading Strategy
This strategy combines the VQ Candlestick Bars MT4 Indicator with a Zero Lag Moving Average MT4 Indicator.
The VQ Candlestick Bars indicator paints individual price bars: a green bar signals a buy opportunity, while a red bar indicates a sell.
The Zero Lag MA acts as a fast trend filter.
When the price is above the moving average, the trend is bullish; when the price is below, the trend is bearish.
By merging a candlestick-based entry with trend confirmation, this strategy is designed to capture efficient day trades with less noise.
The strategy works best on intraday charts like M5, M15, or H1.
It suits day traders who prefer to trade in the direction of the trend, taking advantage of price momentum backed by clear candlestick cues.
Because the Zero Lag MA reduces lag, it offers timely trend validation.
Buy Entry Rules
- Price must be above the Zero Lag Moving Average, indicating a bullish trend.
- The VQ Candlestick Bars must paint a green bar, giving a buy signal.
- Enter a long position at the close of the green bar, provided the moving average condition still holds.
- Set a stop loss just below the most recent intraday swing low.
- Take profit when either:
- The VQ Candlestick Bars paint a red bar (opposite signal), or
- Price closes back below the Zero Lag MA, signaling a trend shift.
Sell Entry Rules
- Price must be below the Zero Lag Moving Average, indicating a bearish trend.
- The VQ Candlestick Bars must paint a red bar, giving a sell signal.
- Enter a short trade at the close of the red bar, as long as the price remains under the MA.
- Place the stop loss just above the most recent intraday swing high.
- Take profit when either:
- The VQ Candlestick Bars next produce a green bar (reverse signal), or
- Price closes back above the Zero Lag MA, indicating potential trend reversal.
Advantages
- Clear entry signals from candlestick coloring help with decision-making.
- The trend filter from the Zero Lag MA increases the probability of staying with the major directional move.
- Reduced lag on the MA helps catch the trend early and filter noise.
- Flexible take‑profit rules: either exit on signal reversal or trend break.
- Works on multiple major currency pairs and intraday timeframes.
Drawbacks
- In choppy markets, candlestick bars may switch color frequently, causing false entries.
- Tight stop losses may be triggered by quick intraday swings.
- Trailing or exit based on color change requires watching closely.
- If price hovers around the MA, entries might be less reliable.
- The strategy may miss early trend reversals if the MA lags slightly despite being zero lag.
Example Case Study 1
On the EUR/USD M15 chart during the London–New York overlap, price climbed above the Zero Lag MA, confirming a bullish trend.
A green VQ candlestick bar appeared, and a long trade was entered at its close.
The stop loss was placed under the recent swing low, about 10 pips below.
Price continued upward, eventually painting a red VQ bar several candles later.
That red bar triggered the exit, and the trade closed profitably with a clean price move and minimal noise.
Example Case Study 2
On GBP/JPY H1, the Zero Lag MA sloped downward, and the price was consistently below it, signaling a bearish trend.
A red VQ candlestick bar was painted, and a short trade was taken at its close.
A stop loss was placed above the recent swing high, 15 pips away.
Later, the price moved down strongly, and then a green VQ bar appeared below the MA, prompting the exit.
The trade ended with a good intraday profit as the bearish trend ran as expected.
Strategy Tips
- Use sessions with higher liquidity, such as London or New York, for more reliable bar signals and trend clarity.
- Avoid entries when the price is tightly range-bound around the Zero Lag MA, stick to strong directional moves.
- Consider using a mini trailing stop once the trade moves in favor to lock in profit without waiting for reversal bars.
- Backtest this strategy on different pairs like USD/CHF, AUD/USD, to find where it performs best.
Download Now
Download the “vq-bars.ex4” Metatrader 4 indicator
FAQ
Is this indicator suitable for scalping?
Yes, it performs well on lower timeframes and provides frequent directional feedback for short-term traders.
Can the VQ indicator detect reversals?
Color changes often signal a shift in momentum, which may precede a reversal or a deeper pullback.
Should this indicator be used with other tools?
Many traders combine it with support and resistance or momentum indicators to refine entries and exits.
Summary
The VQ Candlestick Bars indicator offers a simple yet effective way to monitor trend direction directly on the price chart.
Its color-based logic makes trend recognition fast without adding clutter.
By highlighting both continuation phases and momentum shifts, the indicator fits naturally into trend-following and active trading strategies.
Its flexibility across timeframes makes it a practical choice for traders who value visual trend confirmation.


