About the Wilders DMI Oscillator Indicator
The Wilders DMI Oscillator is a trend strength indicator developed to measure whether a market is trending and how strong that trend currently is.
It is based on the Directional Movement Index concept introduced by J. Welles Wilder, where trend conditions are evaluated using directional pressure and momentum.
The indicator operates on a fixed scale between 0 and 100, allowing traders to quickly judge whether price action is trending or ranging.
According to Wilder’s guidelines, a meaningful trend is present when readings remain above the 25 level. Values below this threshold often indicate sideways or weak market conditions.
The Wilders DMI Oscillator is displayed in a separate indicator window using two lines and color-filled histograms.
These visual elements help traders differentiate between bullish and bearish pressure while also gauging trend intensity.
This indicator is especially useful for traders who want to avoid choppy environments and focus on markets with sustained directional movement.
It works well across different currency pairs and timeframes when applied with disciplined trade management.
Free Download
Download the “wilders-dmi-oscillator.ex4” MT4 indicator
Key Features
- Measures trend strength using Wilder’s directional movement logic.
- Operates on a fixed scale ranging from 0 to 100.
- Uses dual lines to reflect directional pressure.
- Histogram colors highlight bullish and bearish dominance.
- Helps traders filter out low-momentum market conditions.
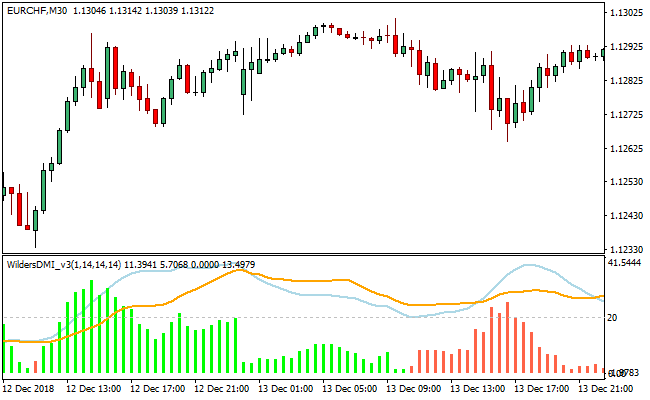
Indicator Chart
The Wilders DMI Oscillator indicator is displayed in a separate window below the price chart.
The chart shows light blue and orange lines moving within the oscillator range, supported by lime and tomato-colored histograms.
These elements highlight trend direction and reveal when momentum strength expands or contracts.

Guide to Trade with the Wilders DMI Oscillator
Buy Rules
- Confirm that the oscillator value is holding above the 25 level.
- Ensure the light blue line remains above the orange line.
- Check that the histogram bars are colored lime.
- Favor buy setups during sustained upward market movement.
Sell Rules
- Confirm that the oscillator value is holding above the 25 level.
- Ensure the light blue line remains below the orange line.
- Check that the histogram bars are colored tomato.
- Favor sell setups during sustained downward market movement.
Stop Loss Rules
- Place the stop loss beyond the most recent swing point.
- Use a wider stop when histogram bars expand above the 20 level.
- Exit early if the oscillator drops back below trend threshold levels.
Take Profit Rules
- Target nearby support or resistance zones.
- Scale out of the trade as histogram strength begins to contract.
- Hold a portion of the position while trend strength remains elevated.
MT4 Wilders DMI + Trend Predictor Scalping Strategy
This strategy uses the Wilders DMI Oscillator MT4 Indicator together with the Trend Predictor v1.0 MT4 Indicator.
The DMI Oscillator shows a histogram: green bars mean bullish trend strength, red bars mean bearish trend strength.
The Trend Predictor gives clear entry arrows: blue for buy, red for sell.
By combining the two, this strategy aims to enter trades when trend strength and entry signals align, which is ideal for short-term scalping on fast charts.
This method is most effective on lower timeframes such as M1, M5, or M15.
It fits scalpers who want quick, directional trades while minimizing the noise by filtering with trend momentum.
Buy Entry Rules
- The Wilders DMI histogram must be green, indicating a bullish trend.
- The Trend Predictor must generate a blue arrow (buy signal).
- Enter a long position when a blue arrow appears and the DMI histogram is green or rising.
- Place the stop loss just below the most recent swing low on the chart.
- Set a take profit target equal to 1 to 1.5 times your stop loss risk, or consider an early exit if the DMI histogram weakens (turns red or shrinks significantly).
Sell Entry Rules
- The Wilders DMI histogram must be red, indicating a bearish trend.
- The Trend Predictor must produce a red arrow (sell signal).
- Enter a short position when the red arrow appears and the DMI histogram is red or increasing in strength.
- Place the stop loss just above the most recent swing high.
- Set take profit at 1 to 1.5× risk, or exit early if the DMI histogram starts turning green or losing strength.
Advantages
- The DMI histogram gives real-time strength of the trend, helping avoid weak or fake moves.
- The Trend Predictor provides precise entry points, reducing guesswork.
- Scalping on low timeframes allows many opportunities per session.
- Risk is well defined with stop loss and take profit rules.
- The strategy works on many forex pairs because both indicators are generic and not pair‑specific.
Drawbacks
- In ranging markets, the DMI histogram may oscillate, producing false confirmation.
- Tight stop losses may be triggered often if the market makes quick counter moves.
- The strategy requires quick execution and discipline due to fast timeframe trades.
- Scalping can be mentally tiring, especially if many trades are taken in a session.
- If the DMI histogram flips too quickly, exits may be suboptimal or late.
Example Case Study 1
On the EUR/GBP M5 chart, the DMI histogram turned green, signaling rising bullish momentum.
Shortly afterward, the Trend Predictor plotted a blue arrow.
A long trade was initiated at the close of that bar, with the stop loss set just below the recent swing low.
Because the DMI histogram remained green and strong, the trade moved in favor quickly.
A take profit was reached at 1.2× risk, locking in a solid scalp move.
Example Case Case Study 2
On AUD/USD M1 during the London session, a red DMI histogram bar appeared, followed by several strong red bars, showing bearish strength.
The Trend Predictor then printed a red arrow, confirming a sell opportunity.
A short position was taken, with a stop loss placed just above the swing high on the chart.
As the pair declined, the DMI histogram persisted in red, and the trade was closed at 1.5× risk, capturing a sharp downward move.
Strategy Tips
- Focus on sessions with good liquidity (e.g., London or New York) to get stronger DMI signals and better execution.
- Ignore Trend Predictor arrows if the DMI histogram is weak or neutral because trend strength validation is key.
- Use a small position size for scalping to manage the higher frequency of trades.
- If the DMI histogram starts to fade or reverse, consider exiting early rather than waiting for full take profit.
- Backtest the strategy on a demo account with different currency pairs (e.g., USD/JPY or GBP/CHF) to find where it works best.
Download Now
Download the “wilders-dmi-oscillator.ex4” Metatrader 4 indicator
FAQ
What does the 25 level represent in the Wilders DMI Oscillator?
The 25 level is commonly used to separate trending markets from non-trending ones.
Readings above this level suggest that momentum is strong enough to support directional trades.
How should histogram colors be interpreted?
Lime histograms indicate bullish momentum, while tomato histograms reflect bearish pressure.
Expansion above the 20 level signals a very strong trend.
Can this indicator be used for scalping?
It can be used on lower timeframes, but it performs best when markets show consistent momentum rather than rapid back-and-forth movement.
Is the Wilders DMI Oscillator suitable as a standalone tool?
It can be traded on its own, but many traders use it as a trend filter alongside entry-focused indicators or price-based setups.
Summary
The Wilders DMI Oscillator provides traders with a focused way to assess trend strength and market direction.
Its bounded scale and visual histogram make it easy to identify when price action is worth trading.
By highlighting strong momentum conditions and filtering out weak phases, the indicator helps traders stay aligned with sustained market moves.
It is a practical tool for anyone looking to trade trends with greater confidence and consistency.


