About the XO Signals Indicator
The XO Signals indicator for MetaTrader 4 is a non-time-based technical indicator derived from point-and-figure charting principles.
Unlike traditional indicators, it does not average price data, allowing buy and sell decisions to be generated in a single, decisive move.
Instead of plotting price against time, the XO indicator focuses on directional price changes.
As a result, signals tend to be cleaner and more decisive, especially during trending conditions.
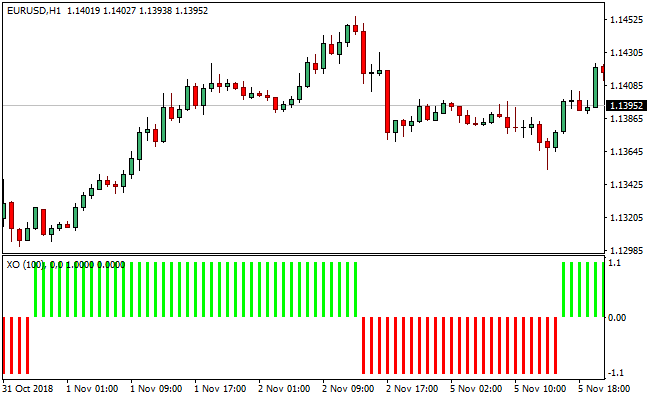
The indicator displays lime and red vertical bars in a separate MT4 window.
Lime bars reflect bullish pressure, while red bars indicate bearish momentum.
With only one adjustable parameter, XO Signals remains simple to use while still offering valuable insight across different trading styles.
Free Download
Download the “xo-indicator.ex4” MT4 indicator
Key Features
- Point-and-figure inspired indicator logic.
- No price averaging for faster signal generation.
- Lime vertical bars for bullish sentiment.
- Red vertical bars for bearish sentiment.
- Displayed in a separate indicator window.
- Single adjustable input parameter.
- Suitable for scalping, day trading, and swing trading.
Indicator Chart
This chart example shows the XO Signals indicator plotted below the main price chart.
The vertical bars stack above or below the zero level, helping traders quickly identify trend direction and momentum shifts without relying on time-based candles.

Guide to Trade with XO Signals Indicator
Buy Rules
- Wait for lime vertical bars to stack above the zero center line.
- Confirm that bullish momentum is consistent across multiple bars.
- Avoid entering buy trades during low-volatility conditions.
- Enter a buy trade once bullish stacking is established.
Sell Rules
- Wait for red vertical bars to line up below the zero signal level.
- Confirm sustained bearish pressure across several bars.
- Avoid selling near strong higher-timeframe support.
- Enter a sell trade once bearish stacking is confirmed.
Stop Loss
- Place the stop loss beyond the most recent consolidation zone.
- Use a fixed pip stop calibrated to the trading timeframe.
- Exit early if bars begin alternating rapidly around the zero line.
Take Profit
- Hold the position while bars continue stacking in the trade direction.
- Take partial profits when momentum starts to slow.
- Close the trade when an opposite-colored bar appears across zero.
MT4 XO Signals + Free Forex Scalping Indicator Scalping Strategy
This strategy combines the XO Signals MT4 Indicator with a free Forex scalping indicator for MT4.
The XO Signals indicator displays a histogram made of vertical bars: green (or lime) bars above zero signal bullish sentiment, and red bars below zero indicate bearish sentiment.
The free scalping indicator also uses a histogram that changes color relative to a zero line: when it turns green above zero, that’s a buy signal; when red below zero, that’s a sell signal.
By combining these two tools, this strategy aims to scalp trades on short intraday timeframes (M1, M5, M15) with both trend/momentum confirmation and timely entries.
The XO histogram provides the broader directional bias (bullish or bearish), while the scalping indicator offers more precise entry signals.
This reduces false entries and increases the probability of catching short, strong moves in the direction of momentum.
Buy Entry Rules
- The XO Signals histogram must show green (lime) bars stacking above the zero line, indicating bullish sentiment.
- The free scalping indicator must turn green above its zero line, signaling a buy.
- Enter a long trade at the close of the candle when the scalping histogram turns green while the XO histogram remains bullish.
- Place a stop loss just below the most recent swing low on the selected timeframe.
- Set a take profit target at about 1 to 1.5 times the stop loss distance, or use a small trailing stop if the move extends.
Sell Entry Rules
- The XO Signals histogram must show red bars below zero, indicating bearish sentiment.
- The free scalping indicator must turn red below its zero line, signaling a sell.
- Enter a short trade at the close of the candle when the scalping histogram turns red while XO remains bearish.
- Place the stop loss just above the most recent swing high on the same timeframe.
- Set take profit at 1 to 1.5 times the risk, or trail the stop manually if the price moves strongly.
Advantages
- Combines a broader momentum/trend view (XO) with precise short-term entries (scalping indicator).
- Provides clear and simple visual signals: histogram colors and zero-line cross.
- Works on very short timeframes (M1, M5, M15) for true scalping.
- Defined risk with stop loss and potential take profit levels.
- Can adapt to any currency pair, as both indicators are not limited by specific markets.
Drawbacks
- Tight stop losses might be hit often if the price is volatile and not trending.
- Trailing stops or manual exits may be difficult on very short timeframes without discipline.
Example Case Study 1
On the USD/CHF M5 chart, the XO Signals histogram turned green and formed a small stack of bars above the zero line, signaling bullish sentiment.
Shortly after, the free scalping indicator’s histogram changed from red to green, crossing above its own zero line.
At the close of that candle, a long trade was opened.
The stop loss was placed just under the recent swing low, around 6 pips. Take profit was set at 9 pips (about 1.5 × risk).
The price moved upward steadily, and the trade hit its take profit, capturing a sharp intraday move in alignment with the momentum.
Example Case Study 2
On GBP/AUD M1 during the London session, the XO histogram printed consecutive red bars below zero, indicating a bearish trend.
Then, the scalping indicator switched to red and dropped below its zero line.
A short position was entered at the candle close.
The stop loss was placed 5 pips above a recent swing high, and the take profit was set at 8 pips.
The price dropped quickly, the move was clean, and the take profit was reached in just a few bars, showing how the combined indicators can work very effectively even on a fast, volatile pair.
Strategy Tips
- Prefer trading during active sessions (e.g., London, New York) when volatility gives better scalping opportunities.
- Wait for clearly defined histogram changes: do not enter when colors are flickering or just hovering around the zero line.
- Use a demo account first to tune the stop loss and take profit levels according to the behavior of the chosen currency pair.
- Always monitor any major economic news; if high-impact news is about to be released, it may be wise to pause scalping.
- Keep a scalp journal to track which pairs, timeframes, and setups give the best results, and refine entries based on performance.
Download Now
Download the “xo-indicator.ex4” Metatrader 4 indicator
FAQ
How is XO Signals different from standard indicators?
XO Signals does not rely on time-based price averaging and instead focuses on directional price changes.
What does the stacking of bars indicate?
Stacking shows sustained momentum in one direction, either bullish or bearish.
Is the indicator difficult to customize?
No. It has only one adjustable parameter, making optimization simple.
Which trading styles suit XO Signals best?
The indicator can be used for scalping, intraday trading, and swing trading depending on timeframe selection.
Summary
The XO Signals MT4 indicator offers a unique perspective by removing time from the equation and focusing purely on directional price movement.
Its vertical bar display provides a clear read on momentum without unnecessary noise.
With minimal settings and decisive signals, XO Signals fits traders who value clarity and fast decision-making.
Applied in trending conditions, it can serve as a strong momentum confirmation tool across multiple trading styles.


