About the Yefekt Signals Indicator
The Yefekt Signals indicator for MetaTrader 4 is a probabilistic reversal and trend analysis tool designed to highlight potential turning points in the market.
It evaluates price behavior around key threshold levels to help traders anticipate momentum shifts.
The indicator operates within a bounded range, using +1 as the upper limit and -1 as the lower limit.
Extreme levels around +0.5 and -0.5 often signal overbought or oversold conditions, which can precede price reversals or short-term corrections.
Yefekt Signals displays lime and red histogram bars in a separate MT4 window.
Lime histograms reflect bullish market sentiment, while red histograms indicate bearish pressure.
The indicator is responsive and works well for scalping and intraday trading when markets are active.
Free Download
Download the “yefekt.ex4” MT4 indicator
Key Features
- Histogram-based probabilistic reversal signals.
- Operates within fixed +1 and -1 boundaries.
- Highlights overbought and oversold market zones.
- Displayed in a separate MT4 indicator window.
- Suitable for scalping and intraday strategies.
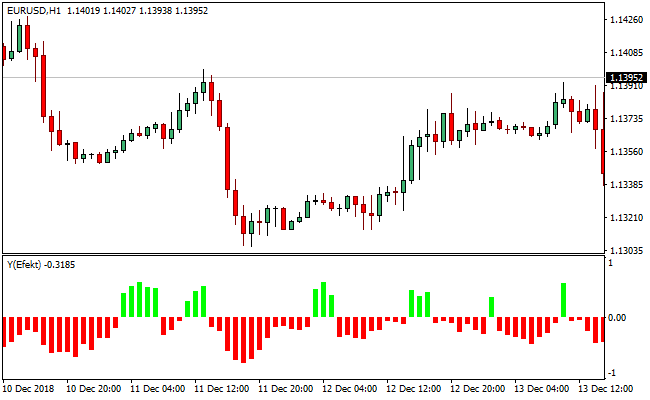
Indicator Chart
This chart example shows the Yefekt Signals indicator plotted below the main price chart.
The histogram bars move around the zero level, helping traders visualize momentum shifts, trend continuation, and early reversal conditions.

Guide to Trade with Yefekt Signals Indicator
Buy Rules
- Watch for lime histogram bars breaking above the zero signal level.
- Confirm that bullish momentum is building.
- Avoid buy trades near major resistance zones.
- Enter the buy trade after the breakout candle closes.
Sell Rules
- Watch for red histogram bars breaking below the zero center line.
- Confirm that bearish momentum is strengthening.
- Avoid sell trades near strong support areas.
- Enter the sell trade after the signal candle closes.
Stop Loss
- For buy trades, place the stop loss a few pips below the -0.5 level reaction zone.
- For sell trades, place the stop loss a few pips above the +0.5 level reaction zone.
- Exit the trade early if the histogram fails to expand after entry.
Take Profit
- Target nearby intraday support or resistance levels.
- Close part of the position as histograms approach extreme zones.
- Exit fully when an opposite-colored histogram appears beyond zero.
MT4 YEFEKT + SuperTrend MTF Trend Strategy
This strategy uses the YEFEKT Signals MT4 Indicator together with the SuperTrend MTF Forex Signal Indicator.
The YEFEKT indicator shows momentum as a histogram: when its green bars are above zero, the bias is upward; when red bars are below zero, the bias is downward.
The SuperTrend MTF indicator overlays a trend line: a green line indicates a bullish trend, and a red line indicates a bearish trend.
By combining both, the strategy trades with momentum in the direction of the trend, reducing false signals and improving the edge.
This method is suitable for both day trading and swing trading.
It works on intraday timeframes (such as M15 or H1) to catch shorter moves, but also on higher timeframes (H4 or D1) to follow stronger trends and capture more extended runs.
It is appropriate for traders who prefer following momentum and trend, rather than counter-trend trading.
Buy Entry Rules
- The YEFEKT histogram must be green and above the zero line, signaling upward momentum.
- The SuperTrend MTF line must be green, confirming a bullish trend.
- Enter a long trade when the histogram crosses above zero (or after a green bar closes above zero) and the SuperTrend line is green.
- Set the stop loss just below the most recent swing low (on the same timeframe).
- Set take profit at 1.5 to 2 times the stop loss distance, or trail the stop using the SuperTrend line.
Sell Entry Rules
- The YEFEKT histogram must be red and below the zero line, signaling downward momentum.
- The SuperTrend MTF line must be red, confirming a bearish trend.
- Enter a short trade when the histogram closes below zero (or after a red bar forms below zero) while SuperTrend is red.
- Place the stop loss just above the most recent swing high.
- Set take profit at 1.5 to 2 times the stop loss, or trail the stop using the SuperTrend line.
Advantages
- Combines momentum and trend for stronger confirmation.
- Helps avoid late entries: the histogram gives early momentum clues, and SuperTrend confirms trend direction.
- Adaptable to different trading styles — scalping, day trading, or swing trading.
- Well-defined risk management with stop loss and take profit rules.
- Works on multiple currency pairs.
Drawbacks
- In choppy or range-bound markets, momentum and trend signals may whipsaw.
- If the SuperTrend line is very close to the price, stop losses may be triggered prematurely.
- The histogram may lag slightly in very fast moves, causing delayed entries.
- Requires monitoring of both indicators to confirm alignment, which may be slower for very short-term trades.
Example Case Study 1
On the AUD/USD H1 chart, the YEFEKT histogram had several red bars but then a green bar closed above zero, indicating a shift in momentum.
Simultaneously, the SuperTrend MTF line turned green.
A long position was taken at the close of that bar. A stop loss was placed just under a nearby swing low.
As the pair continued to rally, a trailing stop was used, following the SuperTrend line to lock in profits.
The trade captured a solid move as AUD/USD climbed in alignment with both momentum and trend.
Example Case Study 2
On GBP/CHF on the H4 timeframe, the YEFEKT histogram moved firmly below zero with consecutive red bars, signaling strong bearish momentum.
At the same time, the SuperTrend line turned red. A short trade was entered on the close of the confirming red bar.
The stop loss was placed just above the prior swing high. The take profit target was set at twice the stop loss distance.
The pair dropped significantly, and the take profit was hit, showing how well the combined indicators can capture a trending move.
Strategy Tips
- Trade only when both indicators align: momentum must confirm the trend.
- Avoid trading when the histogram is flickering around zero — that often signals indecision.
- Use a trailing stop based on the SuperTrend line to lock in profit but allow room to run.
- On higher timeframes, consider a larger trade size because moves tend to be bigger, but risk accordingly.
- Be cautious during major economic news: momentum may reverse quickly even if indicators remain aligned briefly.
Download Now
Download the “yefekt.ex4” Metatrader 4 indicator
FAQ
What does the zero level represent?
The zero level separates bullish and bearish momentum and acts as the primary signal trigger.
Is Yefekt suitable for scalping?
Yes. Its fast histogram response makes it effective for short-term and intraday trading.
What do the +0.5 and -0.5 levels indicate?
These levels often highlight overbought and oversold conditions within the indicator range.
Does the indicator provide alerts?
Yes. Yefekt Signals delivers quick alert triggers to help traders react promptly to new setups.
Summary
The Yefekt Signals MT4 indicator offers a fast and intuitive way to read short-term momentum and potential reversals.
Its histogram-based design makes it easy to spot shifts in market pressure without crowding the chart.
The indicator is particularly useful for active traders who rely on timing and quick feedback.
With clear zero-level signals and defined extreme zones, Yefekt Signals fits well into scalping and intraday workflows.


