About the Strongest vs Weakest Currency Indicator
The Strongest vs Weakest Currency indicator for MT4 scans seven major currencies—USD, EUR, NZD, CHF, JPY, GBP, and AUD—to identify which currency is strongest and which is weakest.
It presents the results in a compact dashboard directly on your main trading chart, making it easy to see potential trade opportunities at a glance.
Traders can use this information to enter trades with high-probability setups.
Go long the strongest currency against the weakest, or go short the weakest against the strongest.
This approach allows you to focus on the most dominant currency trends in the market.
The indicator can be applied across multiple timeframes.
Scalpers and day traders benefit from 1-minute or 5-minute charts, swing traders from hourly charts, and position traders from 4-hour or daily charts.
This versatility makes it suitable for nearly all trading styles.
By quickly identifying currency strength and weakness, the indicator helps traders make informed decisions, avoid weak setups, and increase the likelihood of profitable trades.
Free Download
Download the “I_CloseDifference_v-08.mq4” MT4 indicator
Key Features
- Scans 7 major currencies: USD, EUR, NZD, CHF, JPY, GBP, AUD.
- Displays the strongest and weakest currencies in a compact on-chart dashboard.
- Helps identify high-probability long and short trades.
- Improves decision-making by highlighting dominant market trends.
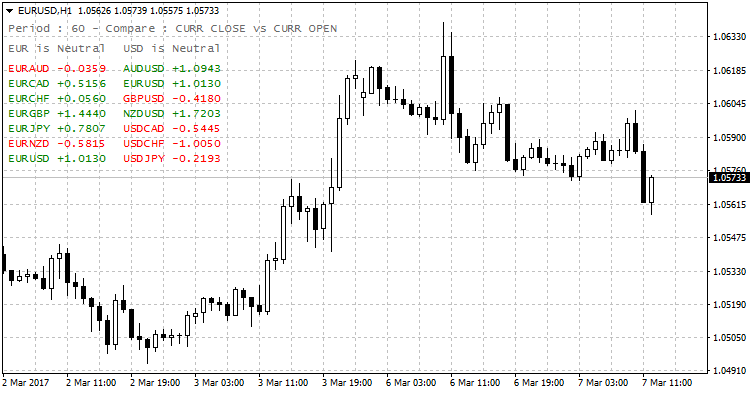
Indicator Chart
The Strongest vs Weakest Currency indicator appears in a small subwindow below the main chart, showing the strongest and weakest currencies in real time.
Traders can quickly scan the dashboard to find potential pairs to trade.
For example, if EUR is strongest and JPY is weakest, you might open a long EUR/JPY position.

Guide to Trade with the Strongest vs Weakest Currency Indicator
Buy Rules
- Identify the strongest currency from the dashboard.
- Confirm the weakest currency from the dashboard.
- Open a buy trade of the strongest currency against the weakest.
- Use trend filters or moving averages to confirm the trade direction.
Sell Rules
- Identify the weakest currency from the dashboard.
- Confirm the strongest currency from the dashboard.
- Open a sell trade of the weakest currency versus the strongest.
- Confirm trend alignment with a longer-term moving average.
Stop Loss
- Place stops near recent swing lows for buy trades.
- Place stops near recent swing highs for sell trades.
- Exit trades if currency strength shifts significantly before reaching profit targets.
Take Profit
- Close buy trades when the strongest currency loses relative strength.
- Close sell trades when the weakest currency gains strength.
- Take partial profits near key support or resistance levels.
- Exit fully if the dashboard shows a reversal in the strongest vs weakest pairing.
Strongest vs Weakest Currency Indicator and Volty Channel Forex Reversal Strategy for MT4
This MT4 forex strategy combines directional bias from the Strong Currency Versus Weak Currency Indicator with dynamic exit management using the Volty Channel Signals Indicator.
The strength indicator continuously scans USD, EUR, NZD, CHF, JPY, GBP and AUD to identify the strongest and weakest currencies, allowing traders to trade only pairs with an imbalance.
The Volty Channel indicator then provides precise momentum signals and color changes that help manage entries and exits more effectively.
This strategy is suitable for scalping and short term trading on M5 and M15 charts and works best during active market sessions.
Buy Entry Rules
- Identify the strongest currency versus the weakest using the strength indicator.
- Select a currency pair where the strongest currency is the base and the weakest is the quote.
- Wait for a blue dot from the Volty Channel Signals indicator.
- Enter a buy trade at the close of the candle with the blue dot.
- Place a stop loss a few pips below the most recent swing low.
- Take profit when the Volty Channel signal changes from blue to red.
Sell Entry Rules
- Identify the weakest currency versus the strongest using the strength indicator.
- Select a currency pair where the weakest currency is the base and the strongest is the quote.
- Wait for a red dot from the Volty Channel Signals indicator.
- Enter a sell trade at the close of the candle with the red dot.
- Place a stop loss a few pips above the most recent swing high.
- Take profit when the Volty Channel signal changes from red to blue.
Advantages
- Uses real-time currency strength to trade only the most imbalanced pairs.
- Dynamic take profit adapts to market momentum instead of fixed targets.
- Helps capture larger moves when trends extend.
- Reduces premature exits during strong directional moves.
- Effective for both scalping and short intraday trades.
Drawbacks
- Profit size can vary depending on how quickly color changes occur.
- Color changes may lag slightly during fast reversals.
- Requires active trade monitoring until exit signal appears.
Example Case Study 1
On EURUSD M5 during the London session, EUR was ranked as the strongest currency and USD as the weakest.
A blue Volty dot appeared after a brief pullback and a buy trade was opened.
Price continued to trend higher for several candles.
Instead of exiting early, the trade was held until the Volty signal changed from blue to red, locking in a 22 pip profit.
The dynamic exit allowed the trend to fully develop.
Example Case Study 2
On GBPJPY M15, the strength indicator showed GBP weakening while JPY remained strong.
A red Volty dot appeared near a minor retracement and a sell trade was entered.
Price moved steadily downward and the position remained open until the Volty color switched from red to blue.
The trade closed with a 38 pip gain, capturing the core of the bearish move without guessing the exit.
Strategy Tips
- Let the Volty color change handle exits to avoid emotional decision making.
- Stronger currency imbalances often lead to longer Volty color persistence.
- Avoid closing trades early unless market conditions change significantly.
- Review past trades to understand how long color phases usually last.
- Use consistent position sizing to manage variable profit outcomes.
Download Now
Download the “I_CloseDifference_v-08.mq4” Metatrader 4 indicator
FAQ
Which currencies does the indicator scan?
It scans USD, EUR, NZD, CHF, JPY, GBP, and AUD to determine relative strength and weakness.
Which timeframes are recommended?
Scalpers and day traders use 1-minute or 5-minute charts, swing traders use hourly charts, and position traders use 4-hour or daily charts.
Can it be used for all trading strategies?
Yes. It is strategy-neutral and highlights dominant currency trends, supporting scalping, day trading, swing trading, and position trading.
Does it update in real time?
Yes. The dashboard updates dynamically as currency strength changes, allowing traders to react to market shifts promptly.
Summary
The Strongest vs Weakeast Currency indicator provides a simple yet powerful way to identify dominant and weak currencies in real time.
By focusing on the strongest versus weakest pairs, traders can enter high-probability trades aligned with market momentum.
When combined with trend confirmation tools, it becomes an essential resource for scalping, day trading, swing trading, and position trading on MT4.


