
About the MAxCD Indicator
The MAxCD Indicator, also known as the three Moving Averages Convergence/Divergence indicator, is a specialized oscillator designed to provide a deep look into trend synchronization.
Unlike a standard MACD that uses two moving averages, this tool incorporates three distinct moving averages to generate its data.
The primary benefit of using this tool is its ability to filter out weak market moves.
By requiring all three histogram components to align, the indicator helps traders avoid entering during minor retracements or choppy price action.
This triple-confirmation approach is highly effective for trend followers who want to capture high-probability swings.
Free Download
Download the “MAxCD.mq4” MT4 indicator
Key Features
- Advanced triple-layer histogram system for identifying total market alignment.
- Responsive oscillator logic that tracks short, medium, and long-term momentum.
- Visual zero-line crossovers that signify shifts in the primary trend direction.
- Easy-to-read colored bars that represent the behavior of three separate moving averages.
- Operates effectively across all MT4 timeframes for diverse trading styles.
Indicator Chart
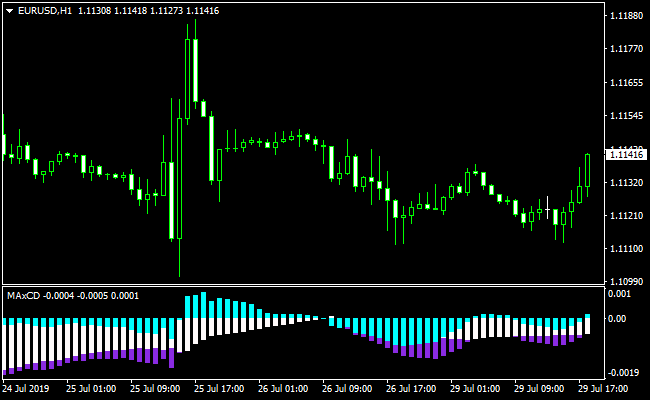
The MAxCD Indicator chart features a dedicated sub-window containing three stacked histogram bars for every price candle.
When all three bars are plotted above the zero line, it indicates a confirmed bullish environment.
Conversely, when all three bars appear below the zero line, it confirms a bearish market state.
This visual layout allows you to immediately recognize whether the trend is fully supported or if the momentum is beginning to diverge.
Guide to Trade with MAxCD Indicator
Buy Rules
- Monitor the oscillator sub-window for a shift in the histogram bars.
- Wait for all three colored histogram bars of the MAxCD Indicator to align above the zero level.
- Confirm the price action on the main chart shows bullish characteristics.
- Execute a buy position once the alignment is confirmed at the candle close.
Sell Rules
- Monitor the oscillator sub-window for a shift in the histogram bars.
- Wait for all three colored histogram bars of the MAxCD Indicator to align below the zero level.
- Confirm the price action on the main chart shows bearish characteristics.
- Execute a sell position once the alignment is confirmed at the candle close.
Stop Loss
- Place your stop loss a few pips below the most recent swing low for buy trades.
- Place your stop loss a few pips above the most recent swing high for sell trades.
- Use a volatility-based stop if the market is moving with high velocity.
- Ensure your stop loss is positioned outside of immediate market noise.
Take Profit
- Set a profit target at a logical technical level like a previous major support or resistance.
- Consider exiting the trade if the histogram bars lose alignment or begin to shrink toward the zero line.
- Utilize a trailing stop loss to lock in gains as the trend continues in your favor.
- Aim for a reward-to-risk ratio that supports your long-term trading plan.
Three Moving Averages Convergence/Divergence and OSMA Scalping MT4 Strategy
This MT4 scalping strategy combines the Three Moving Averages Convergence Divergence MaxCD MT4 Indicator with the Oscillator of Moving Average (OSMA) MT4 Indicator.
The MaxCD indicator identifies trend direction: a bullish trend is confirmed when all three histogram bars are above zero, and a bearish trend is confirmed when all three bars are below zero.
The OSMA provides entry signals with a histogram above zero for buys and below zero for sells.
This strategy is designed for fast scalping on M1 and M5 charts.
By combining trend confirmation from MaxCD with precise entry timing from OSMA, traders can enter high-probability trades while minimizing risk from countertrend moves.
Buy Entry Rules
- The MaxCD histogram bars must all be above zero, confirming a bullish trend.
- The OSMA histogram must be above zero, signaling a buy entry.
- Enter long at the close of the candle where the OSMA first crosses above zero while MaxCD bars remain positive.
- Set a stop loss a few pips below the recent swing low or support level.
- Take profit when the OSMA histogram crosses back below zero or trail the stop to follow momentum.
Sell Entry Rules
- The MaxCD histogram bars must all be below zero, confirming a bearish trend.
- The OSMA histogram must be below zero, signaling a sell entry.
- Enter short at the close of the candle where the OSMA first crosses below zero while MaxCD bars remain negative.
- Set a stop loss a few pips above the recent swing high or resistance level.
- Take profit when the OSMA histogram crosses back above zero or trail the stop to secure profits.
Advantages
- Combines trend confirmation with precise entry signals for higher probability trades.
- Visual histogram signals make scalping decisions fast and straightforward.
- Dynamic exit using OSMA flips allows capturing realistic intraday moves.
- Works well on M1 and M5 charts for active scalping sessions.
- It can be applied to multiple currency pairs to maximize trading opportunities.
- Reduces the risk of entering against the prevailing trend.
Drawbacks
- Sideways or choppy markets can produce false signals and frequent small losses.
- Requires quick execution and attention, especially on M1 charts.
- Lower volatility periods may produce fewer viable setups.
Case Study 1
EURUSD M1 during the London session showed all three MaxCD histogram bars above zero, confirming a bullish trend.
The OSMA histogram moved above zero shortly after.
A long position was opened with a stop loss below the recent swing low.
Price moved upward steadily, and the trade was closed when OSMA flipped below zero, capturing a 15-pip profit.
Using trend confirmation reduced the risk of countertrend trades on the fast M1 chart.
Case Study 2
GBPUSD M5 during the New York session displayed all MaxCD histogram bars below zero, signaling a bearish trend.
The OSMA histogram then moved below zero, confirming the sell entry.
A short trade was taken with a stop loss above the recent swing high.
Price moved downward, and the trade was closed when OSMA crossed above zero, producing a 28-pip gain.
Strategy Tips
- Trade during active sessions with higher volatility to maximize signal reliability.
- Wait for full alignment between MaxCD bars and OSMA histogram before entering to avoid false entries.
- Use tight stops and adjust based on current volatility to minimize risk on M1 and M5 charts.
- Move the stop loss to breakeven once the trade reaches halfway to the OSMA exit point.
- Check higher time frames to confirm the overall trend and avoid countertrend scalping trades.
Download Now
Download the “MAxCD.mq4” Metatrader 4 indicator
FAQ
What makes the MAxCD Indicator different from a standard MACD?
The standard MACD typically looks at the relationship between two moving averages.
The MAxCD Indicator adds a third moving average into the calculation, requiring a higher degree of agreement before a trend is confirmed.
This extra layer acts as a powerful filter against false signals that often occur in two-line crossover systems.
Can I use the MAxCD Indicator for scalping on the M1 timeframe?
While the indicator is responsive enough for M1 trading, it is generally more reliable on the M15 or H1 charts.
Within these timeframes, the triple-alignment logic has enough price data to filter out the high-frequency noise that often produces erratic histogram movements on the 1-minute chart.
Is it necessary to combine this tool with other indicators?
It is highly recommended to use the MAxCD Indicator alongside other tools like support and resistance levels or a long-term moving average.
Using this oscillator to trigger entries into the direction of a higher-timeframe trend significantly increases the probability of a successful trade.
Summary
The MAxCD Indicator offers a robust framework for identifying trend strength through its unique triple-histogram design.
By focusing on the convergence of three separate moving averages, it provides a more comprehensive view of market momentum than standard oscillators.
Its usability is a major advantage, as the zero-line alignment provides an objective rule for entering and exiting the market.
To improve your trading results, focus on high-liquidity sessions where the momentum is most likely to follow through once the bars align.


