
About the dTrends Star Signals Indicator
The dTrends Star Signals Indicator is a streamlined technical tool designed to identify high-probability entry points by following short-term price momentum.
It simplifies the trading process by distilling complex trend data into easy-to-read visual markers on the chart.
This indicator operates by analyzing price velocity and direction, providing immediate feedback when the market shifts from a bearish to a bullish state or vice versa.
By focusing on trend continuity, it helps traders stay on the right side of the market during active sessions.
It is particularly suited for those who prefer a clean chart layout and objective signal generation during fast-moving market conditions.
Free Download
Download the “dTrends.mq4” MT4 indicator
Key Features
- Visual star markers provide instant buy and sell signals directly on the price action.
- Responsive tracking of short-term trend shifts to capture early momentum.
- Flexible application across multiple timeframes from scalping to swing trading.
- Works effectively as an entry trigger when aligned with long-term moving averages.
Indicator Chart
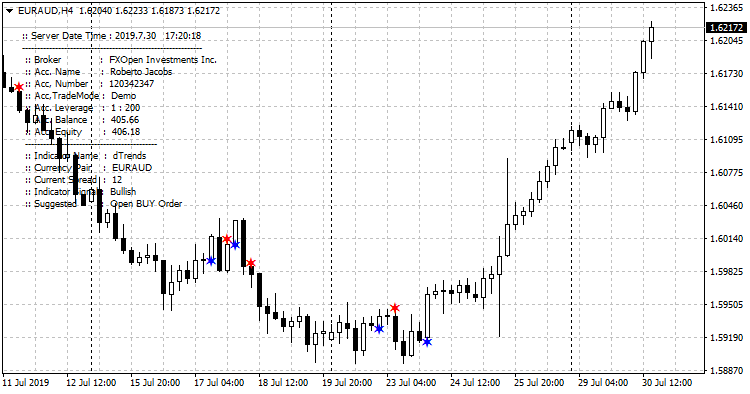
The dTrends Star Signals Indicator chart displays distinct colored stars above and below the price candles.
A blue star appearing below the price signifies a bullish shift, while a red star appearing above the price indicates a bearish turn.
This visual setup makes it simple to track the immediate trend direction at a glance.
Guide to Trade with dTrends Star Signals Indicator
Buy Rules
- Verify that the long-term trend is bullish by checking if price is above a 200 SMA.
- Wait for a blue star to appear below a closed candle.
- Open a buy position at the start of the next candle.
- Ignore any red stars that appear while the overall trend remains upward.
Sell Rules
- Verify that the long-term trend is bearish by checking if price is below a 200 SMA.
- Wait for a red star to appear above a closed candle.
- Open a sell position at the start of the next candle.
- Ignore any blue stars that appear while the overall trend remains downward.
Stop Loss
- Set your protective stop loss a few pips beyond the most recent structure high or low for a logic-based exit.
- Utilize a volatility-based stop by placing the exit point at two times the current ATR value from your entry.
- Shift your stop loss to the entry price once the market has moved in your favor by the amount of your initial risk.
Take Profit
- Set a take profit target at the next major support or resistance level.
- Alternatively, exit the trade when an opposite colored star appears on the chart.
- Consider trailing your stop loss to lock in profits as the trend progresses.
MT4 DTrends Star Signal and DSP Histogram Forex Scalping Strategy
This MT4 scalping strategy combines the DTrends Star Signals MT4 Indicator with the Detrended Synthetic Price Histogram MT4 Indicator.
The first tool delivers the trade entries, showing a blue star as a buy signal and a red star as a sell signal.
The DSP Histogram indicator confirms the trend direction with green bars for bullish movement and red bars for bearish pressure.
The strength of this approach comes from combining trend filtering with precise entries.
The DSP Histogram removes noise and highlights the dominant direction.
The DTrends Star Signals indicator reacts quickly and provides clear visual entries that help scalpers catch fast intraday moves.
This setup works best on M1, M5, and M15 charts during active trading sessions.
When both indicators agree, trades often move immediately in the expected direction.
Buy Entry Rules
- The DSP Histogram must show green bars to confirm a bullish trend.
- A blue star from the DTrends Star Signals indicator must appear after or while the histogram remains green.
- Enter long at the close of the blue star candle.
- Set a stop loss around 8 to 15 pips below the entry, depending on volatility.
- Target 10 to 25 pips on M5 or 15 to 30 pips on M15.
Sell Entry Rules
- The DSP Histogram must show red bars to confirm a bearish trend.
- A red star from the DTrends Star Signals indicator must appear after or while the histogram remains red.
- Enter short at the close of the red star candle.
- Set a stop loss around 8 to 15 pips above the entry.
- Target 10 to 25 pips on M5 or 15 to 30 pips on M15.
Advantages
- Clear trend confirmation from the histogram reduces false entries.
- Star signals provide fast and precise scalping entries.
- Works well during sessions with strong momentum.
- Easy to follow because both indicators display visual signals.
- Suitable for beginners who need structured rules.
Drawbacks
- Sideways markets may produce mixed histogram colors and reduce signal quality.
- Not ideal in very low volatility conditions.
Case Study 1
On EURUSD M5 during the London session, the DSP Histogram turned fully green, confirming upward pressure.
A few minutes later, the DTrends indicator printed a blue star.
A long entry was opened with a 12 pip stop loss.
The pair gained momentum and delivered a 22 pip profit before slowing down.
The histogram trend filter helped avoid entering too early during consolidation.
Case Study 2
GBPJPY M15 showed strong selling movement during the New York session.
The DSP Histogram turned red and maintained bearish momentum.
A red star signal appeared shortly after a minor pullback.
The trade was entered with a 15 pip stop loss and reached the target for a 28 pip gain.
The combination of trend direction and entry timing produced a smooth, low drawdown trade.
Strategy Tips
- Trade only when the histogram stays clearly green or red to ensure strong trend alignment.
- Skip trades when the histogram switches colors frequently, as this indicates unstable conditions.
- Focus on London and New York sessions where momentum is strongest.
- Prefer setups where the star signal appears early in the trend because these often produce the fastest moves.
Download Now
Download the “dTrends.mq4” Metatrader 4 indicator
FAQ
How does the dTrends Star Signals Indicator handle ranging markets?
In sideways or ranging markets, any trend-following tool can produce multiple signals.
This is why it is essential to use the recommended moving average filter.
By only taking signals that align with the 200 SMA or 100 EMA, you significantly reduce the risk of being caught in false breakouts during consolidation.
Can I use this indicator on the 1-minute chart?
Yes, the dTrends Star Signals Indicator is responsive enough for M1 trading.
However, for the best balance between signal frequency and accuracy, many traders find the M15 and H1 timeframes to be the sweet spot for these types of momentum stars.
Is it better to use a 100 EMA or a 200 SMA as a filter?
The choice depends on your trading style.
A 100 EMA reacts faster to price changes and provides more trading opportunities, whereas a 200 SMA is more conservative and helps you stay with the very strongest long-term trends.
Summary
The dTrends Star Signals Indicator offers a straightforward way to engage with the market by highlighting short-term trend reversals.
Its simplicity is its greatest strength, providing clear triggers that take the guesswork out of market timing.
To achieve the best results, always remember to trade in the direction of the dominant trend as established by a longer-term moving average.
This disciplined approach ensures that you are using the stars to join high-velocity moves rather than fighting against the primary market flow.


