About the MACD Indicator
The MACD indicator for MT4, short for Moving Average Convergence Divergence, is one of the most widely used momentum and trend indicators in forex trading.
It measures the relationship between two exponential moving averages and uses a signal line to highlight trend changes.
The MACD oscillator fluctuates above and below the zero line.
Readings above zero indicate bullish conditions, while readings below zero indicate bearish conditions. Crosses of the zero line signal potential trend reversals.
Traders can also use MACD to identify divergences between price and momentum, highlighting potential reversal points before price action confirms them.
It works across all currency pairs, including majors, minors, and exotics, and on any timeframe.
Its combination of trend and momentum analysis helps traders make informed entry and exit decisions.
Free Download
Download the “MACD.mq4” MT4 indicator
Key Features
- Tracks momentum and trend changes using EMA-based calculations.
- Fluctuates above and below a zero line to indicate bullish or bearish conditions.
- Signals trend reversals when the MACD crosses the zero line.
- Can be used to detect divergences for early signals.
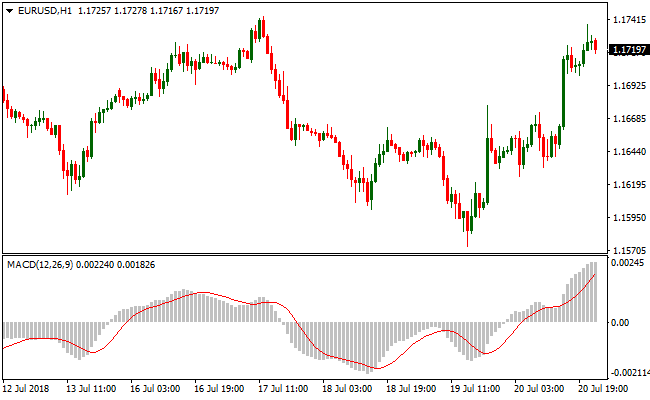
Indicator Chart
The MACD indicator appears beneath the main price area as an oscillator with a MACD line, signal line, and histogram.
The histogram shows the distance between the MACD line and the signal line, highlighting bullish and bearish momentum.
Crosses above or below zero indicate potential trend changes.

Guide to Trade with the MACD Indicator
Buy Rules
- Wait for the MACD line to cross above the zero line from below.
- Confirm overall trend direction using a longer-term moving average.
- Open a buy trade when momentum strengthens above zero.
- Avoid trades against the dominant downtrend.
Sell Rules
- Wait for the MACD line to cross below the zero line from above.
- Confirm overall trend direction using a longer-term moving average.
- Open a sell trade when momentum strengthens below zero.
- Avoid trades against the dominant uptrend.
Stop Loss
- Place the stop below recent support for buy trades and above recent resistance for sell trades.
- Exit trades if MACD reverses and crosses back over the zero line prematurely.
- Close trades early if momentum fails to continue in the trade direction.
Take Profit
- Secure partial profits near key support or resistance levels.
- Exit fully if an opposite zero-line cross occurs or divergence signals a reversal.
MACD and Heiken Ashi Trend Signals Forex Day Trading Strategy
This MT4 day trading strategy blends the classic MACD indicator with the Heiken Ashi Trend Signals indicator to provide signals that help traders catch intraday trends with better timing.
The MACD indicator shows whether momentum is bullish or bearish based on whether it is above or below the zero level.
The Heiken Ashi Trend Signals indicator smooths price action so that a series of green candles indicate a bullish trend and a series of orange candles indicate a bearish trend.
When both indicators align, day traders get confirmation that price movement is likely to continue in the same direction.
This strategy is ideal for active day traders using M5, M15, and M30 charts, especially on highly liquid currency pairs such as EURUSD, GBPUSD, and USDCHF.
By combining momentum and trend, traders can enter with greater confidence and ride intraday moves while the conditions remain favorable.
Buy Entry Rules
- Ensure the MACD histogram and line are above the zero level, indicating bullish momentum.
- Confirm that a series of Heiken Ashi green candles is forming, showing a bullish trend.
- Enter a buy trade at the close of the candle where both MACD and Heiken Ashi conditions align.
- Place the stop loss below the most recent swing low or below the last Heiken Ashi red/orange candle low.
- Exit the trade when the MACD drops below zero or when a series of Heiken Ashi orange candles appears.
Sell Entry Rules
- Ensure the MACD histogram and line are below the zero level, indicating bearish momentum.
- Confirm that a series of Heiken Ashi orange candles is forming, showing a bearish trend.
- Enter a sell trade at the close of the candle where both MACD and Heiken Ashi conditions align.
- Place the stop loss above the most recent swing high or above the last Heiken Ashi green candle high.
- Exit the trade when the MACD rises above zero or when a series of Heiken Ashi green candles appears.
Advantages
- Combines momentum and trend signals to reduce false entries.
- Works well on multiple intraday timeframes, giving flexibility to different day trading styles.
- Heiken Ashi smoothing reduces market noise and helps spot clearer trends.
- MACD provides objective confirmation of underlying momentum before entry.
- Defined exit conditions help protect profits and limit losses.
Drawbacks
- Can give delayed entries during rapid market moves since both indicators must align.
- Sideways or range-bound markets may produce multiple false signals.
- Requires active monitoring during the trading session to manage trades and exits.
- Moderate pip targets demand discipline and consistent execution.
- May result in smaller gains if the trend weakens before hitting ideal take profit levels.
Example Case Study 1
On the M15 EURUSD chart during a morning London session trend, the MACD remained above zero, indicating bullish momentum.
A series of Heiken Ashi green candles formed as the price continued upward.
A buy trade was entered at the close of the confirming candle with the stop loss placed below the recent swing low.
Price continued higher as both indicators stayed aligned.
The trade was closed when the MACD dropped below zero in the later session.
The trade captured 55 pips during this active intraday move.
Example Case Study 2
On the M5 GBPCHF chart during a midday session, the MACD dipped below zero, showing bearish momentum.
Heiken Ashi showed a sequence of orange candles confirming the downtrend.
A sell trade was entered at candle close with the stop loss placed above the most recent swing high.
Price continued dropping with aligned indicators.
The trade was closed when Heiken Ashi began showing green reversal candles.
This trade captured 27 pips during this short trend continuation move.
Strategy Tips
- Check the higher timeframe trend (H1) before trading on lower timeframes to improve signal reliability.
- Wait for both MACD and Heiken Ashi conditions to clearly align before entering a trade to avoid early entries.
- Use well defined support and resistance areas to improve entry timing and risk management.
- Manage risk by keeping positions small relative to account size and move stop to breakeven when possible.
- Exit promptly when indicators flip to preserve gains and avoid larger reversals.
Download Now
Download the “MACD.mq4” Metatrader 4 indicator
FAQ
How do I read MACD histogram changes?
The histogram shows the gap between the MACD line and the signal line.
Expanding bars indicate strengthening momentum, while shrinking bars suggest momentum is slowing.
Can MACD signals be used for short-term trading?
Yes. MACD works on all timeframes.
On lower timeframes, it helps spot intraday trend changes, while higher timeframes are better for swing and position trades.
What role do zero-line crosses play?
Crosses above zero signal a shift to bullish momentum, while crosses below zero indicate bearish momentum.
They are key for timing trend-aligned entries.
Should I use MACD with other indicators?
Combining MACD with trend filters or moving averages reduces false signals and increases confidence in trade direction.
Summary
The MACD indicator provides a reliable way to measure both trend direction and momentum, offering actionable buy and sell signals through zero-line crosses, histogram changes, and divergence detection.
When combined with trend filters, MACD helps align trades with market momentum while managing risk effectively.


