
About the Super Stochastic Buy Sell Indicator
The Super Stochastic Buy Sell indicator for MT4 is a trend-following oscillator that blends classic stochastic logic with a moving average filter.
This combination helps smooth out raw stochastic movements and makes trend direction easier to interpret.
Unlike a standard stochastic oscillator, this version uses color changes to communicate market conditions.
A green line signals bullish momentum, a red line signals bearish momentum, and a yellow line represents a neutral or transitioning phase.
This visual approach allows traders to react quickly without overanalyzing indicator values.
The default settings use an 89-period stochastic combined with a 9-period moving average.
This creates a slower, more stable signal that works well across different market conditions.
Traders can modify the input parameters to adjust sensitivity and adapt the indicator to their personal trading style.
Free Download
Download the “ml-ift stochastic mtf shadow 1_3 (alerts + arrows).ex4” MT4 indicator
Key Features
- Combines stochastic oscillator with a moving average filter.
- Color-based trend signals for quick interpretation.
- Green, red, and yellow states reflect market direction.
- Fully adjustable input settings.
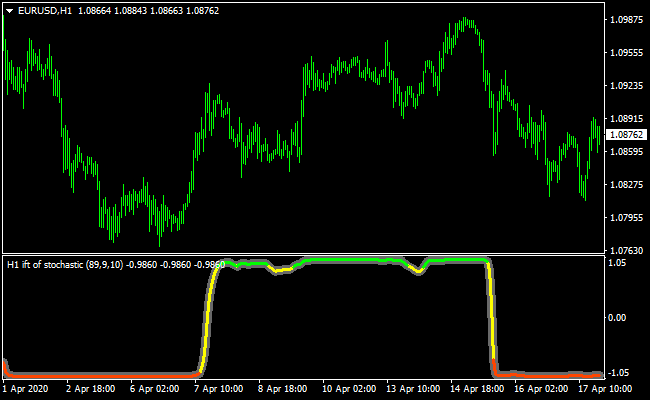
Indicator Chart
The chart shows the Super Stochastic Buy Sell indicator displayed in a separate oscillator window.
The oscillator line changes color based on trend conditions.
Green signals indicate bullish momentum, red signals indicate bearish momentum, and yellow signals highlight neutral or transitioning phases.
Guide to Trade with Super Stochastic Buy Sell Indicator
Buy Rules
- Open a buy trade when the oscillator changes color from yellow to green.
- Confirm that price action supports bullish momentum.
- Prefer buy signals aligned with the higher timeframe trend.
- Avoid buy entries during sideways market conditions.
Sell Rules
- Open a sell trade when the oscillator changes color from yellow to red.
- Confirm that price action supports bearish momentum.
- Prefer sell signals aligned with the higher timeframe trend.
- Avoid sell entries during low volatility ranges.
Stop Loss
- Place the stop loss 1-3 pips below recent support for buy trades.
- Place the stop loss 1-3 pips above recent resistance for sell trades.
- Use recent swing points as alternative stop references.
Take Profit
- Set take profit when the oscillator changes to the opposite color.
- Use nearby support or resistance levels as profit targets.
- Apply fixed risk to reward ratios such as 1:2 or higher.
- Trail stops during strong trending moves.
Super Stochastic + Kaufman Bands Forex Scalping Strategy
This MT4 strategy combines the power of two fast-reacting indicators: the Super Stochastic Buy Sell Indicator and the Kaufman Bands Indicator.
It is designed for traders who prefer clear trend signals and quick scalping entries.
The Super Stochastic uses a green line to signal buy conditions and a red line for sell conditions.
The Kaufman Bands react to volatility and show trend direction with blue dots in bullish conditions and red dots in bearish conditions.
Together, they create a simple but effective system that works well on M5 and M15 charts.
This strategy suits beginners and experienced traders who want a structured approach to capturing short bursts of momentum.
It focuses on clean trend confirmation, simple rules, and practical exits.
Buy Entry Rules
- The Super Stochastic green line appears, showing a buy signal.
- Kaufman Bands display blue dots, confirming a bullish trend.
- Enter a buy as soon as the candle closes with both conditions aligned.
- Set the stop loss below the nearest swing low or below the lower Kaufman Band.
- Take profit at 15–30 pips on M5 or 25–40 pips on M15.
Sell Entry Rules
- The Super Stochastic red line appears, showing a sell signal.
- Kaufman Bands display red dots, confirming a bearish trend.
- Enter a sell as soon as the candle closes with both conditions aligned.
- Set the stop loss above the nearest swing high or above the upper Kaufman Band.
- Take profit at 15–30 pips on M5 or 25–40 pips on M15.
Advantages
- Clear buy and sell trading signals for quick decision-making.
- Combines momentum and volatility for higher accuracy.
- Very easy to apply to fast intraday charts.
- Reduces false signals by requiring confirmation from both indicators.
Drawbacks
- Not suitable for long-term positions.
- Requires discipline to avoid early entries.
Case Study 1: EURUSD M5 Scalping Example
EURUSD was trending upward during the London session, and a green Super Stochastic line appeared shortly after a pullback.
At the same moment, Kaufman Bands shifted to blue dots, confirming bullish pressure.
A buy entry was triggered at 1.0915 with a stop loss set below the recent swing low at 1.0905.
The trend resumed smoothly, and the price pushed higher within minutes.
The take profit at 20 pips was reached at 1.0935.
Case Study 2: GBPJPY M15 Downtrend Scalping Example
GBPJPY entered a strong bearish trend after the Asian session.
A red Super Stochastic line appeared at the start of a new impulse wave.
Kaufman Bands also printed red dots, confirming that volatility was expanding in the sell direction.
A short entry was taken at 196.20 with a stop loss above the previous high near 196.45.
The pair continued falling for the next few candles and reached the 35-pip take profit target at 195.85.
Strategy Tips
- Stick to sessions with strong liquidity, especially London and early New York.
- Always wait for both signals to align; do not enter early if only one indicator fires.
- Use the lower time frames only when market momentum is clear and consistent.
- Consider moving the stop loss to breakeven after half of the target is reached.
Download Now
Download the “ml-ift stochastic mtf shadow 1_3 (alerts + arrows).ex4” Metatrader 4 indicator
FAQ
What makes Super Stochastic different from a regular stochastic?
It adds a moving average filter and uses color changes instead of raw values, making trend direction easier to follow.
Are the default settings suitable for all markets?
The default 89 and 9 settings work well for most pairs, but traders can adjust them to increase or reduce sensitivity.
Can this indicator be used alone?
Yes, but many traders prefer combining it with price action or trend confirmation tools for better accuracy.
Summary
The Super Stochastic Buy Sell indicator for MT4 offers a practical way to follow market momentum using intuitive color changes.
By smoothing traditional stochastic signals with a moving average, it reduces noise and improves readability.
Its flexibility across timeframes and markets makes it suitable for many trading styles.
Traders who fine-tune the settings and apply solid risk management can use this indicator as a reliable momentum and trend confirmation tool within their trading approach.


