
About the Daily and Weekly Price Breakout Indicator
The Daily and Weekly Price Breakout indicator for MT4 is a straightforward price action tool that plots key high and low levels directly on the chart.
It displays the previous day’s high and low, along with the previous week’s high and low, giving traders instant access to important breakout zones.
These levels are widely followed by professional traders because they often act as decision points where volatility expands.
When price breaks beyond a prior high or low and closes outside that range, it can signal the start of a new directional move.
The indicator is designed to keep analysis simple. There are no complex calculations or lagging components.
Traders focus purely on how price behaves around the plotted levels.
This makes it especially useful for breakout traders who rely on momentum and continuation setups.
It works well across all currency pairs and timeframes and can be used for intraday breakout trades or higher timeframe weekly setups.
Free Download
Download the “DayWeekHL_v1.ex4” MT4 indicator
Key Features
- Plots the previous daily high and low levels.
- Plots the previous weekly high and low levels.
- Ideal for breakout and momentum trading strategies.
- Works on all MT4 timeframes and currency pairs.
- Clean chart display focused on price action.
Indicator Chart
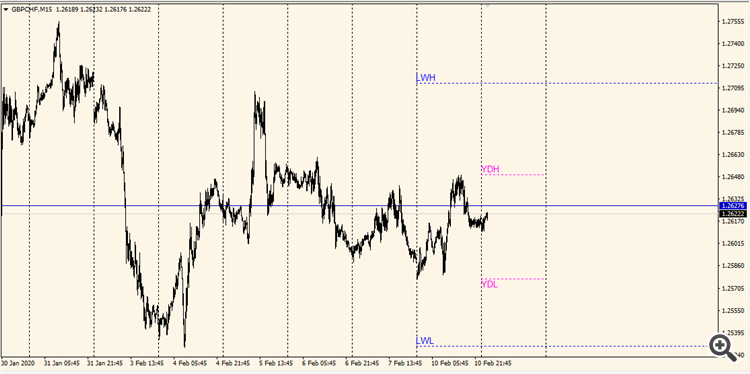
The chart shows the Daily and Weekly Price Breakout indicator applied to an MT4 chart.
Horizontal lines mark the previous daily and weekly high and low prices.
Traders watch for candle closes beyond these levels to identify potential buy or sell breakout opportunities.
Guide to Trade with Daily and Weekly Price Breakout Indicator
Buy Rules
- Open a buy trade when price closes above the previous daily or weekly high.
- Confirm that the breakout candle closes firmly above the level.
- Prefer buy breakouts aligned with higher timeframe bullish bias.
- Avoid entries during low volatility or major news uncertainty.
Sell Rules
- Open a sell trade when price closes below the previous daily or weekly low.
- Confirm that the breakout candle closes firmly below the level.
- Prefer sell breakouts aligned with higher timeframe bearish bias.
- Avoid entries when price is ranging tightly around the level.
Stop Loss
- Place the stop loss below the breakout level for buy trades.
- Place the stop loss above the breakout level for sell trades.
- Alternatively, use the most recent swing high or low.
- Keep position risk consistent across all trades.
Take Profit
- Set take profit using a fixed risk to reward ratio such as 1:2 or higher.
- Use the next major support or resistance zone as a target.
- Partial profits can be taken once price moves decisively in favor.
- Trailing stops may be applied during strong breakout momentum.
Daily & Weekly Breakout + Forex Trend Filter AO MT4 Swing Strategy
This swing trading strategy combines the Daily and Weekly Breakout MT4 Indicator and the Forex Trend Filter AO MT4 Indicator.
The Daily and Weekly Breakout indicator shows previous daily and weekly high and low levels.
A buy breakout occurs when the price closes above the daily or weekly high, while a sell breakout occurs when the price closes below the daily or weekly low.
The Forex Trend Filter AO adds a momentum confirmation layer: the histogram above zero signals bullish conditions, while below zero signals bearish conditions.
By combining breakout levels with trend confirmation, this strategy allows swing traders to enter higher probability moves in the direction of the market momentum.
It is best suited for H1 and H4 charts, making it ideal for intraday to multi-day swing trades.
Traders can capture meaningful price swings without the stress of rapid scalping.
Buy Entry Rules
- Price closes above the previous daily or weekly high, confirming a breakout.
- The Forex Trend Filter AO histogram is above zero, confirming bullish momentum.
- Enter a long position at the close of the breakout candle.
- Place a stop loss just below the breakout candle low or a few pips below the previous high.
- Take profit options:
- Fixed target: 40–70 pips on H1, 75–150 pips on H4.
- Trend exit: hold until the AO histogram crosses below zero.
- Partial exit: secure half profits at a fixed target and let the remainder ride with trend exit.
Sell Entry Rules
- Price closes below the previous daily or weekly low, confirming a bearish breakout.
- The Forex Trend Filter AO histogram is below zero, confirming bearish momentum.
- Enter a short position at the close of the breakout candle.
- Stop loss above the breakout candle high or slightly above the previous low.
- Take profit options:
- Fixed target: 40–40 pips on H1, 75–150 pips on H4.
- Trend exit: close the trade when the AO histogram crosses above zero.
- Partial exit: take half at a fixed target and leave the rest to follow trend exit.
Advantages
- Breakout levels provide clear price-based entry criteria.
- The AO histogram acts as a trend filter to reduce false breakouts.
- Flexible exit options: fixed, trend-following, or partial profits.
- Well-suited for H1 and H4 swing trades capturing multi-day moves.
- Works on most liquid currency pairs and major crosses.
Drawbacks
- Whipsaw breakouts can trigger false signals during low volatility.
- Momentum confirmation may lag slightly in fast reversals.
- Fixed targets may be missed if the trend reverses abruptly.
- Requires monitoring if using trend exit rules over multiple days.
Example Case Study 1: EUR/USD on H1
During the London session, EUR/USD broke above the previous daily high.
The AO histogram was above zero, confirming bullish momentum.
A long position was taken at the close of the breakout candle with a stop below the breakout low.
Price continued upward, hitting a 65-pip target.
The trade could have been held longer using the trend exit rule, as the histogram remained positive for several hours.
Example Case Study 2: GBP/JPY on H4
GBP/JPY broke below the previous weekly low, signaling a bearish breakout.
The AO histogram was below zero, confirming momentum.
A short trade was entered with a stop above the breakout high.
Over the next two days, the pair dropped steadily, reaching a 130-pip target.
The trend exit rule could have extended profits slightly further as the histogram remained negative.
Strategy Tips
- Focus on highly liquid pairs like EUR/USD, GBP/JPY, USD/JPY, and AUD/USD for reliable breakout moves.
- Confirm that breakouts are clean and not caused by single wicks; consider waiting for the candle to close beyond the level.
- Use the trend exit method for strong trending markets, fixed targets for choppier conditions.
- Adjust stop losses according to the volatility of the pair.
- Monitor breakout trades during news events to avoid unexpected spikes.
Download Now
Download the “DayWeekHL_v1.ex4” Metatrader 4 indicator
FAQ
Should I trade daily or weekly breakouts?
Daily breakouts offer more frequent opportunities, while weekly breakouts tend to produce fewer but stronger moves.
Choice depends on your trading style and patience.
Is confirmation required before entering trades?
Waiting for a candle close beyond the level helps reduce false breakouts.
Many traders also confirm momentum with volume or candle size.
Can this indicator be used with other tools?
Yes, it pairs well with trend filters, session timing, or volatility indicators to refine breakout quality.
Summary
The Daily and Weekly Price Breakout indicator for MT4 is a practical tool for traders who focus on price expansion beyond key historical levels.
Its simplicity keeps attention on what matters most, price movement.
By highlighting important daily and weekly highs and lows, the indicator helps traders plan breakout trades with defined entry points and logical risk placement.
With disciplined execution and proper filtering, it can support a consistent breakout trading approach.


