About the Dynamic Pivot Point Indicator
The Dynamic Pivot Point indicator for MT4 is a flexible trading tool built around classic pivot point logic, enhanced with adjustable timeframe control.
Unlike standard pivot indicators that are locked to a fixed calculation period, this indicator allows traders to select the pivot point timeframe directly from the settings menu.
This dynamic approach means pivot levels calculated on higher timeframes, such as H1, H4, or Daily, can be displayed on lower charts like M1 or M5.
This gives traders a broader market perspective while executing precise entries on their preferred timeframe.
The main pivot point is displayed as a gold line and acts as the central reference level.
When price trades above it, market sentiment is considered bullish. When price trades below it, sentiment shifts bearish.
Support and resistance levels are automatically plotted, providing natural profit targets and decision zones.
Free Download
Download the “Dynamic Pivot.ex4” MT4 indicator
Key Features
- Dynamic pivot point calculation with selectable timeframes.
- Supports pivot periods from M1 up to Monthly.
- Gold pivot line for directional bias.
- Automatic resistance and support levels.
- Ideal for multi-timeframe trading strategies.
Indicator Chart
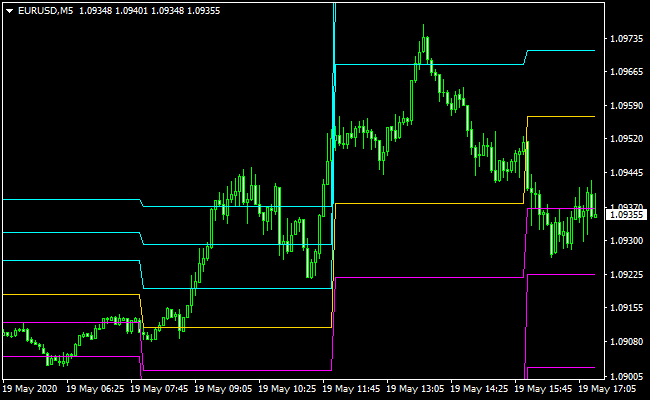
The chart displays the Dynamic Pivot Point indicator applied to an MT4 price chart.
The gold line represents the main pivot point, while aqua lines mark resistance levels and magenta lines mark support levels.
Buy and sell decisions are guided by how price closes relative to the pivot and how it reacts near support and resistance.

Guide to Trade with the Dynamic Pivot Point Indicator
Buy Rules
- Open a buy trade when price closes above the Dynamic Pivot Point from below.
- Confirm that price remains above the gold pivot line after the close.
- Prefer buy setups when the higher timeframe bias is bullish.
- Avoid buying directly into nearby resistance levels.
Sell Rules
- Open a sell trade when price closes below the Dynamic Pivot Point from above.
- Confirm that price holds below the gold pivot line.
- Prefer sell setups when the higher timeframe bias is bearish.
- Avoid selling directly into nearby support levels.
Stop Loss
- Place the stop loss below the nearest support level for buy trades.
- Place the stop loss above the nearest resistance level for sell trades.
- Use recent swing highs or lows as alternative stop references.
Take Profit
- Set take profit at resistance levels 1, 2, and 3 for buy trades.
- Set take profit at support levels 1, 2, and 3 for sell trades.
- Scale out of positions as price reaches each level.
- Trailing stops can be used once price moves beyond the first target.
Dynamic Pivot Point + XTC Forex Trend MT4 Day Trading Strategy
This day trading strategy combines the Dynamic Pivot Point MT4 Indicator and the XTC Forex Trend MT4 Indicator.
The Dynamic Pivot Point acts as a trend filter: when the price is above the pivot point, the market is considered bullish, while below the pivot point, it is bearish.
The XTC Trend Indicator shows blue bars for buy signals and red bars for sell signals, providing precise entry points within the trend.
This combination allows traders to take trades in the direction of the prevailing trend while using the XTC bars to enter at high-probability points.
It works best on M15 and M30 charts for day trading, capturing intraday swings without holding positions overnight.
This strategy is suitable for traders looking for structured, low-stress intraday setups.
Buy Entry Rules
- Price must be above the Dynamic Pivot Point, confirming a bullish trend.
- XTC Trend Indicator must show a blue bar, signaling a buy entry.
- Enter long at the close of the blue bar candle.
- Place a stop loss below the nearest swing low or just under the pivot point.
- Take profit options:
- Fixed target: 25–40 pips on M15, 40–70 pips on M30.
- Trend exit: close when price closes below the pivot point or the XTC bar turns red.
Sell Entry Rules
- Price must be below the Dynamic Pivot Point, confirming a bearish trend.
- XTC Trend Indicator must show a red bar, signaling a sell entry.
- Enter short at the close of the red bar candle.
- Place a stop loss above the nearest swing high or just above the pivot point.
- Take profit options:
- Fixed target: 25–40 pips on M15, 40–70 pips on M30.
- Trend exit: close when the price closes above the pivot point or the XTC bar turns blue.
Advantages
- Pivot point filter ensures trades follow the main intraday trend.
- XTC bars provide clear, timely entry points within the trend.
- Flexible take-profit methods: fixed target or trend-based exit.
- Works well on liquid currency pairs during high-volume sessions.
- Easy to implement and visually intuitive.
Drawbacks
- Pivot points can lag during sudden volatility spikes.
- Small profit targets may be affected by broker spreads.
- Requires monitoring of both price relative to pivot and XTC bar changes.
Example Case Study 1: EUR/USD on M15
During the London session, EUR/USD was trading above the Dynamic Pivot Point, signaling a bullish trend.
Shortly after, the XTC Trend Indicator printed a blue bar.
A long position was taken at the close of the bar with a stop loss below the recent swing low.
Price moved steadily upward, reaching a 30-pip target.
The trend remained intact, and the position could also have been held until a color change on the XTC bars for extended gains.
Example Case Study 2: GBP/JPY on M30
In the New York session, GBP/JPY dropped below the pivot point, indicating a bearish trend.
The XTC Trend Indicator then showed a red bar.
A short trade was entered at the candle close with a stop above the previous swing high.
The price fell steadily, hitting a 50-pip take profit.
The trade could also have been managed using the trend exit rule, closing the position if the price moved back above the pivot point or the XTC bar turned blue.
Strategy Tips
- Focus on liquid pairs such as EUR/USD, GBP/JPY, USD/JPY, and AUD/USD.
- Only take trades when both the pivot point and XTC bar confirm the direction.
- Avoid trading during low liquidity periods to reduce false signals.
- Adjust stop-loss distances according to volatility to avoid early stop-outs.
- Use trend-based exits during strong trending days to maximize profits.
- Backtest the strategy across multiple sessions to identify the best-performing pairs.
Download Now
Download the “Dynamic Pivot.ex4” Metatrader 4 indicator
FAQ
What makes this pivot point indicator dynamic?
The indicator allows traders to choose the pivot calculation timeframe manually.
This enables higher timeframe pivot levels to be used on lower charts.
Which pivot timeframe works best?
Intraday traders often use H1 or H4 pivot points, while swing traders may prefer Daily or Weekly settings.
The best choice depends on your trading horizon.
Can this indicator be used for scalping?
Yes, many scalpers use higher timeframe pivots on M1 or M5 charts to trade short-term reactions around major levels.
Does the indicator adjust automatically to market sessions?
The pivot levels update based on the selected timeframe.
Session behavior must be interpreted by the trader through price action.
Summary
The Dynamic Pivot Point indicator for MT4 offers a practical and adaptable way to trade around key market levels.
Its adjustable timeframe settings make it suitable for traders who value multi-timeframe analysis.
By combining directional bias from the pivot line with structured support and resistance targets, the indicator supports disciplined trade planning and consistent execution.
With proper testing and risk management, it can become a valuable component of a level-based trading approach.


