
About the Engulfing Moving Average Forex Signals Indicator
The Engulfing Moving Average Forex Signals indicator for MT4 is designed to help traders spot momentum shifts using a combination of moving averages and engulfing price behavior.
It focuses on identifying moments when price action decisively moves above or below the selected moving average, suggesting a potential change in market direction.
This indicator displays straightforward buy and sell arrows directly on the chart.
A blue arrow signals bullish pressure, while a red arrow signals bearish momentum.
The logic behind these signals is rooted in an engulfing interaction with the moving average, which often reflects increased participation from market players.
Traders can select from multiple moving average calculation methods, allowing the indicator to adapt to different trading styles.
You can use the indicator on its own or combine it with price action, support and resistance, or other technical tools to refine entries and exits.
Free Download
Download the “engulfing_MA.ex4” MT4 indicator
Key Features
- Generates buy and sell arrows based on engulfing interactions with a moving average.
- Supports Simple, Exponential, Smoothed, and Linear Weighted moving averages.
- Works on all MT4 currency pairs and timeframes.
- Non-repainting signals once the candle closes.
- Suitable for standalone trading or as part of a broader strategy.
Indicator Chart
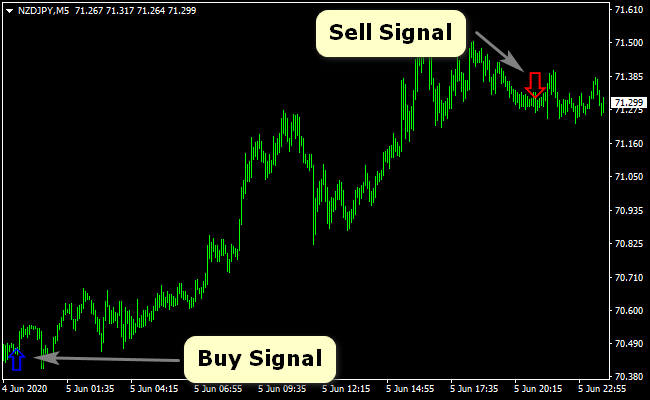
The chart below shows the Engulfing Moving Average Forex Signals indicator applied to a live MT4 chart.
Blue arrows highlight bullish buy signals, while red arrows mark bearish sell signals.
The arrows appear when price action engulfs the selected moving average, helping traders align entries with directional momentum.
Guide to Trade with Engulfing Moving Average Forex Signals
Buy Rules
- Open a buy trade when a blue engulfing arrow appears on the chart.
- Ensure the candle closes above the selected moving average.
- Prefer buy signals that align with a rising moving average slope.
- Avoid buy entries directly below strong resistance zones.
Sell Rules
- Open a sell trade when a red engulfing arrow appears on the chart.
- Ensure the candle closes below the selected moving average.
- Prefer sell signals that align with a falling moving average slope.
- Avoid sell entries directly above strong support zones.
Stop Loss
- Place the stop loss below the most recent swing low for buy trades.
- Place the stop loss above the most recent swing high for sell trades.
- Alternatively, use a fixed stop based on average candle size.
- Keep risk per trade consistent across all positions.
Take Profit
- Set take profit when an opposite signal arrow appears.
- Use nearby support or resistance levels as logical exit targets.
- Apply a fixed risk to reward ratio such as 1:2 or higher.
- Partial profits can be taken while trailing the remaining position.
Engulfing MA + Gann Trend Oscillator MT4 Forex Strategy
This strategy combines two powerful tools to capture clean continuation setups in trending markets.
The Engulfing Moving Average Forex Signals Indicator generates clear buy and sell arrows based on engulfing price action around a moving average.
A blue up arrow marks a buy condition, while a red down arrow marks a sell condition.
The Gann Trend Oscillator MTF Indicator confirms the underlying market direction with its color-coded histogram.
Blue bars represent a bullish trend, and violet bars represent a bearish trend.
This combination filters out weak engulfing patterns, ensuring trades are taken only when both price action and trend structure align.
The strategy works well on M15, M30, and H1 charts, making it practical for day traders and steady intraday swing traders.
Buy Entry Rules
- The Gann Trend Oscillator histogram must be blue.
- A blue up arrow must appear from the Engulfing Moving Average indicator.
- Enter long at the close of the arrow candle.
- Stop loss below the previous swing low.
- Take profit options:
- Fixed target: 25–40 pips (M15), 40–70 pips (M30), or 70–120 pips (H1).
- Momentum exit: close the trade as soon as the Gann histogram changes from blue to violet.
- Partial exit: take half profit at a fixed pip target and close the rest when the histogram changes color.
Sell Entry Rules
- The Gann Trend Oscillator histogram must be violet.
- A red down arrow must appear from the Engulfing Moving Average indicator.
- Enter short at the close of the arrow candle.
- Stop loss above the previous swing high.
- Take profit options:
- Fixed target: 25–40 pips (M15), 40–70 pips (M30), or 70–120 pips (H1).
- Momentum exit: close the trade the moment the Gann histogram shifts from violet to blue.
- Partial exit: secure partial profits early, then exit the rest on histogram color change.
Advantages
- Clear arrow-based entries make the system easy to follow.
- Gann histogram filtering removes many losing counter-trend signals.
- Flexible take-profit rules improve adaptability.
- Works well across multiple currency pairs with steady trends.
- Suitable for traders who prefer structured and simple setups.
Drawbacks
- Choppy markets can produce misleading engulfing signals.
- Histogram color changes may occur too early in volatile conditions.
- Trading near strong support or resistance requires caution.
Example Case Study 1: AUD/USD on M30
During the Asian session, AUD/USD entered a steady bullish phase.
The Gann Trend Oscillator printed continuous blue bars, confirming the trend.
After several candles, a blue up arrow appeared from the Engulfing Moving Average indicator following a strong engulfing pattern.
A buy entry was placed at the close. Price advanced smoothly and reached a 45-pip gain.
The histogram stayed blue the entire time, so the position was held until the fixed target was reached.
Example Case Study 2: CAD/JPY on H1
During the London session, CAD/JPY shifted into a bearish swing.
The Gann Trend Oscillator turned violet, indicating a downtrend.
Shortly after, a clean red down arrow appeared from the Engulfing MA indicator. A short entry was taken.
Price dropped steadily for several candles.
Instead of using a fixed take-profit, the trade was managed with the momentum exit rule.
The position was closed when the Gann histogram changed from violet to blue, capturing 82 pips.
Strategy Tips
- Use the Gann histogram as the main trend filter; avoid trades when it is flat or mixed.
- Fixed targets are safer during low volatility, while color-change exits work better in trending markets.
- Pairs like AUD/USD, EUR/USD, CAD/JPY, EUR/JPY, and GBP/USD respond well to this approach.
- Avoid trading engulfing arrows directly into strong support or resistance.
- During strong trends, hold positions longer and trail stops below higher lows or above lower highs.
- Backtest both exit methods to find which performs best for your preferred pair.
Download Now
Download the “engulfing_MA.ex4” Metatrader 4 indicator
FAQ
Which moving average method works best with this indicator?
Exponential and Linear Weighted moving averages tend to react faster to price changes.
Simple and Smoothed options are better suited for traders who prefer fewer signals.
Is this indicator suitable for lower timeframes?
Yes, it performs well on lower timeframes such as M5 and M15. Using a faster moving average can help adapt it to short-term trading.
Summary
The Engulfing Moving Average Forex Signals indicator for MT4 offers a practical way to trade momentum-based setups without unnecessary complexity.
Its arrow-based signals are easy to follow and adapt well to different market conditions.
With multiple moving average options and compatibility across all pairs and timeframes, it provides flexibility for a wide range of trading styles.
Traders who combine it with solid risk management and additional confirmation tools may further improve consistency and overall performance.


